Most traders lose money by doing too much.
You don’t get paid for being active — you get paid for being patient.
This article introduces a simple but powerful weekly framework built on three metrics:
Bitcoin (BTC), Bitcoin Dominance (BTC.D), and TOTAL3 (Altcoin Market Cap).
Together, they reveal where capital is flowing — and more importantly, where it is not.
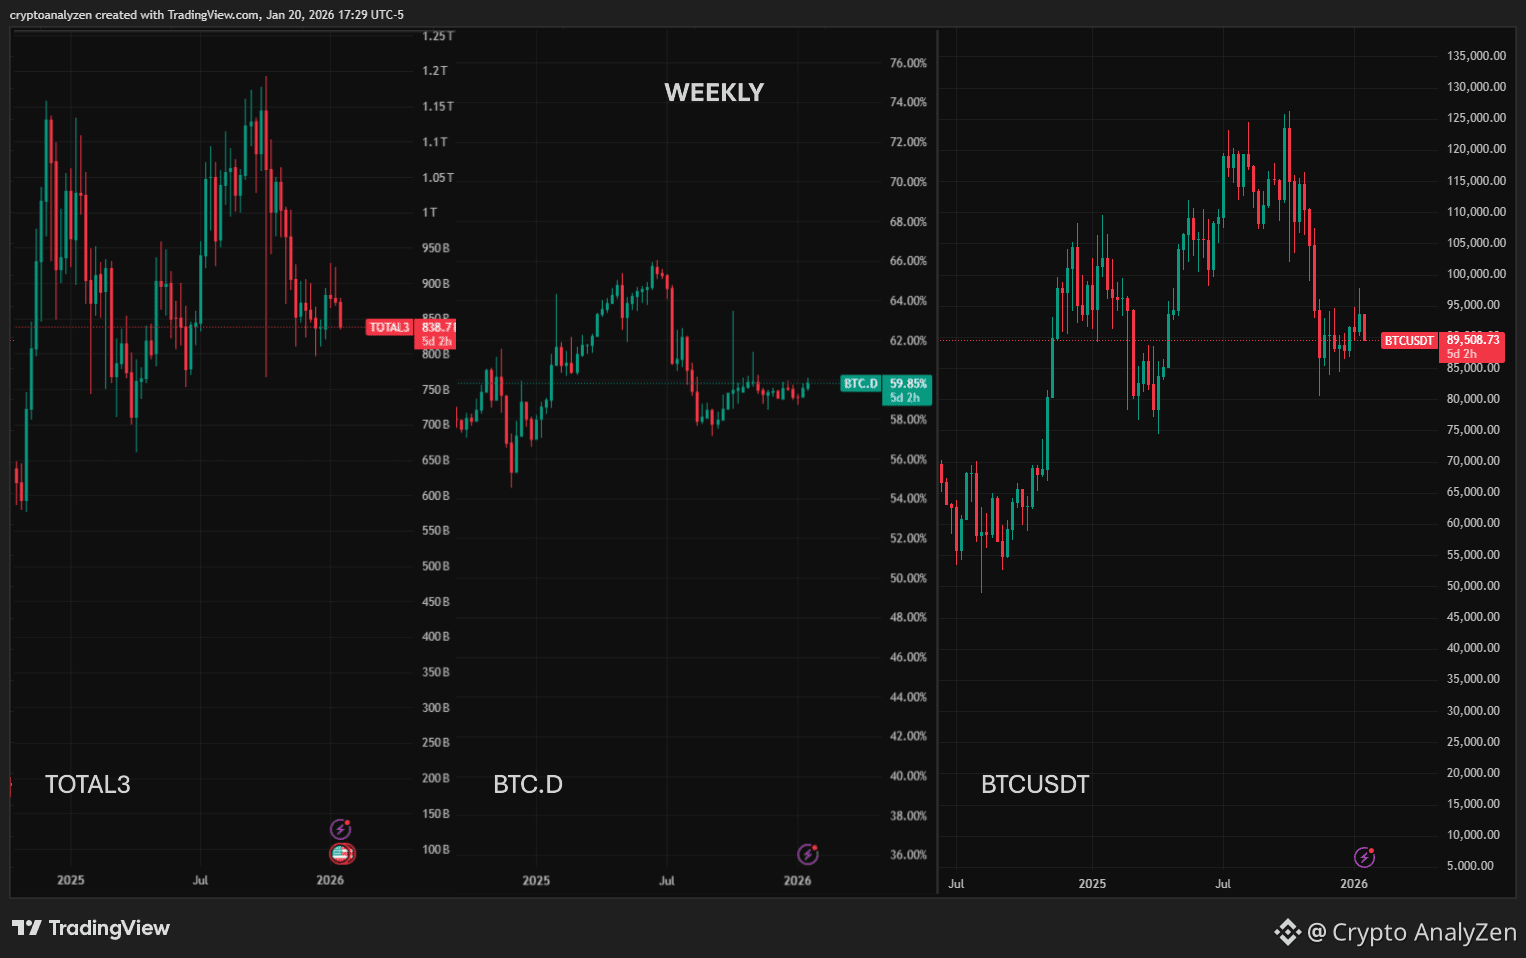
🟠 Bitcoin (BTC) — Weekly Structure
Bitcoin is still trading inside a macro uptrend, but after the strong expansion phase into the 120K area, the market has entered its first meaningful corrective leg.
Key observations:
• The trend structure (Higher Highs / Higher Lows) is still intact
• Momentum has cooled off
• Price is consolidating around the 85K–90K support zone
Weekly Scenarios:
• Holding above 85K → Base formation & continuation potential
• Weekly close below 85K → Deeper correction toward 78K–72K zone
🔵 Bitcoin Dominance (BTC.D) — Weekly Rotation Signal
BTC Dominance recently expanded from the 40% area to above 65%. After such a strong move, BTC.D is now in a consolidation phase.
Key observations:
• Momentum is slowing
• No decisive breakout yet
• The next directional move will define capital rotation
Weekly Scenarios:
• Break above 61% → Bitcoin outperforms altcoins
• Break below 58% → Altcoin season conditions begin
🟣 TOTAL3 — Altcoin Market Cap (Excluding BTC & ETH)
TOTAL3 shows the real strength of the altcoin market. After a powerful expansion, it is now trading inside a wide, volatile range.
Key observations:
• Trend structure still bullish
• Current phase = compression & uncertainty
Weekly Scenarios:
• Weekly close above 900B → Altcoin continuation
• Weekly close below 830B → Risk-off for altcoins
Conclusion
This is not a trending market — it’s a transitioning market.
And in transition phases, the most profitable action is often waiting.
Less trades.
Better timing.
Stay out of chaos.
