
30 assets from the TOP-200 by market capitalization on the 12-hour time frame according to our indicator showed a potential low mark on the current candle. What does this mean and how should it be interpreted? It suggests a high probability of a significant rebound and short- to medium-term growth of the cryptocurrency market, starting in the coming days. AT THE SAME TIME, during these upcoming days, the low may still be updated; this is an important remark. A rebound requires confirmation from stable trends on lower time frames.
All 30 assets in the new report are visible to P73 CryptoMarket Monitor subscribers, and we'll be revealing a third of them publicly:
- #AAVE,
-#THEREIS,
- #ATOM,
- #CAKE,
- #DONE,
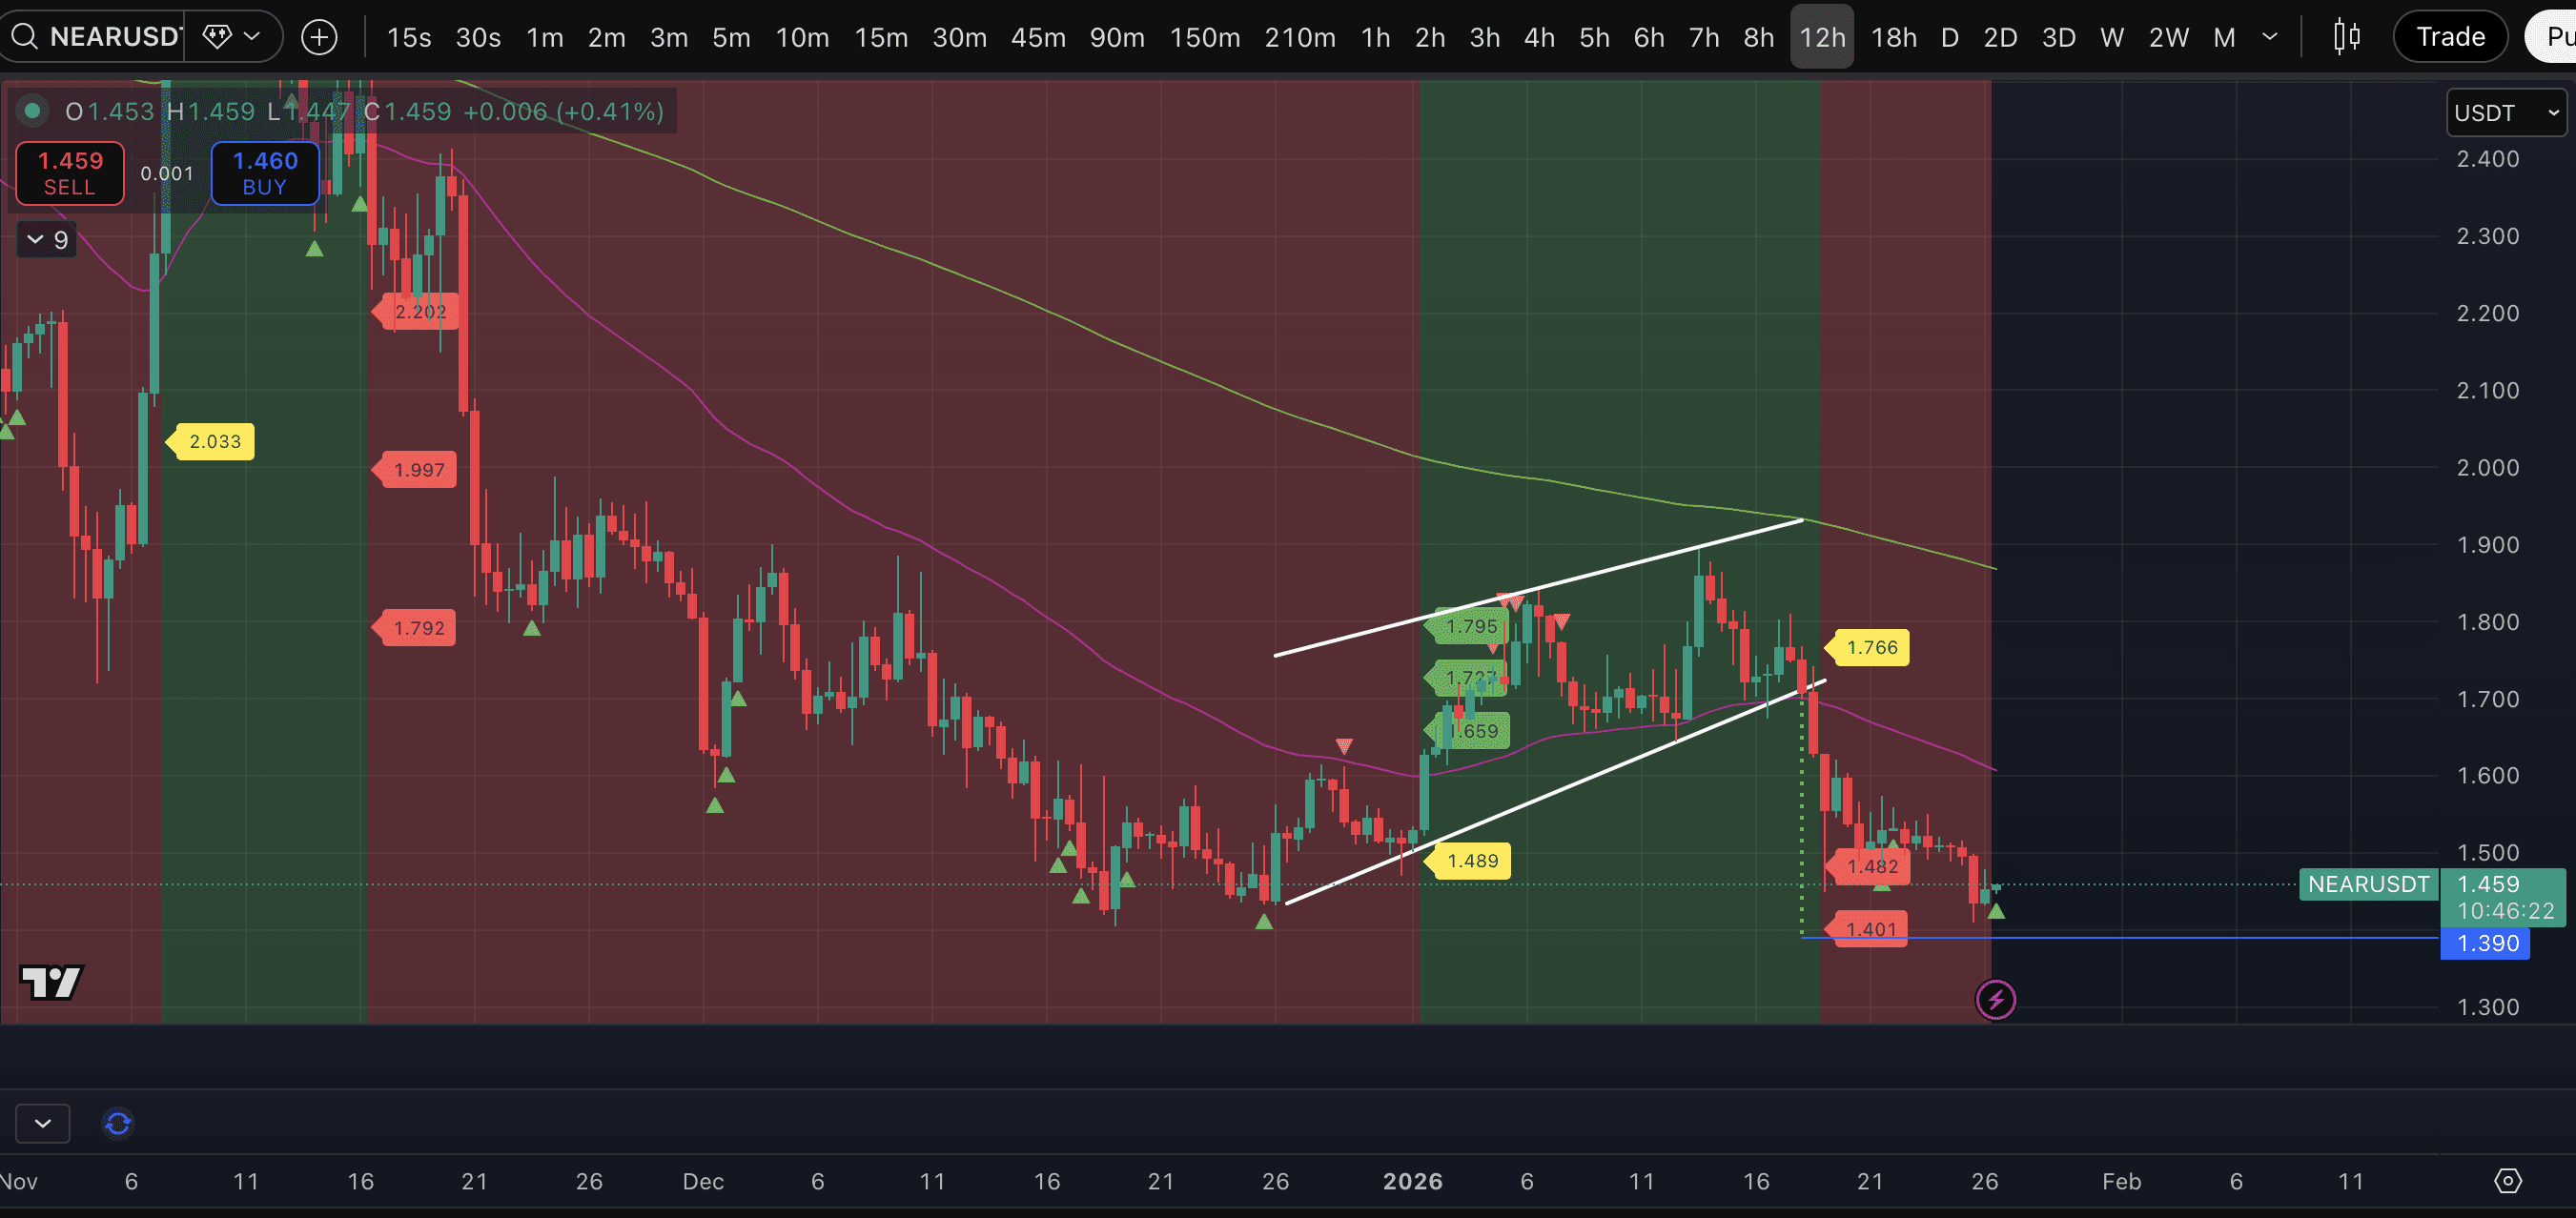
- #NEAR,
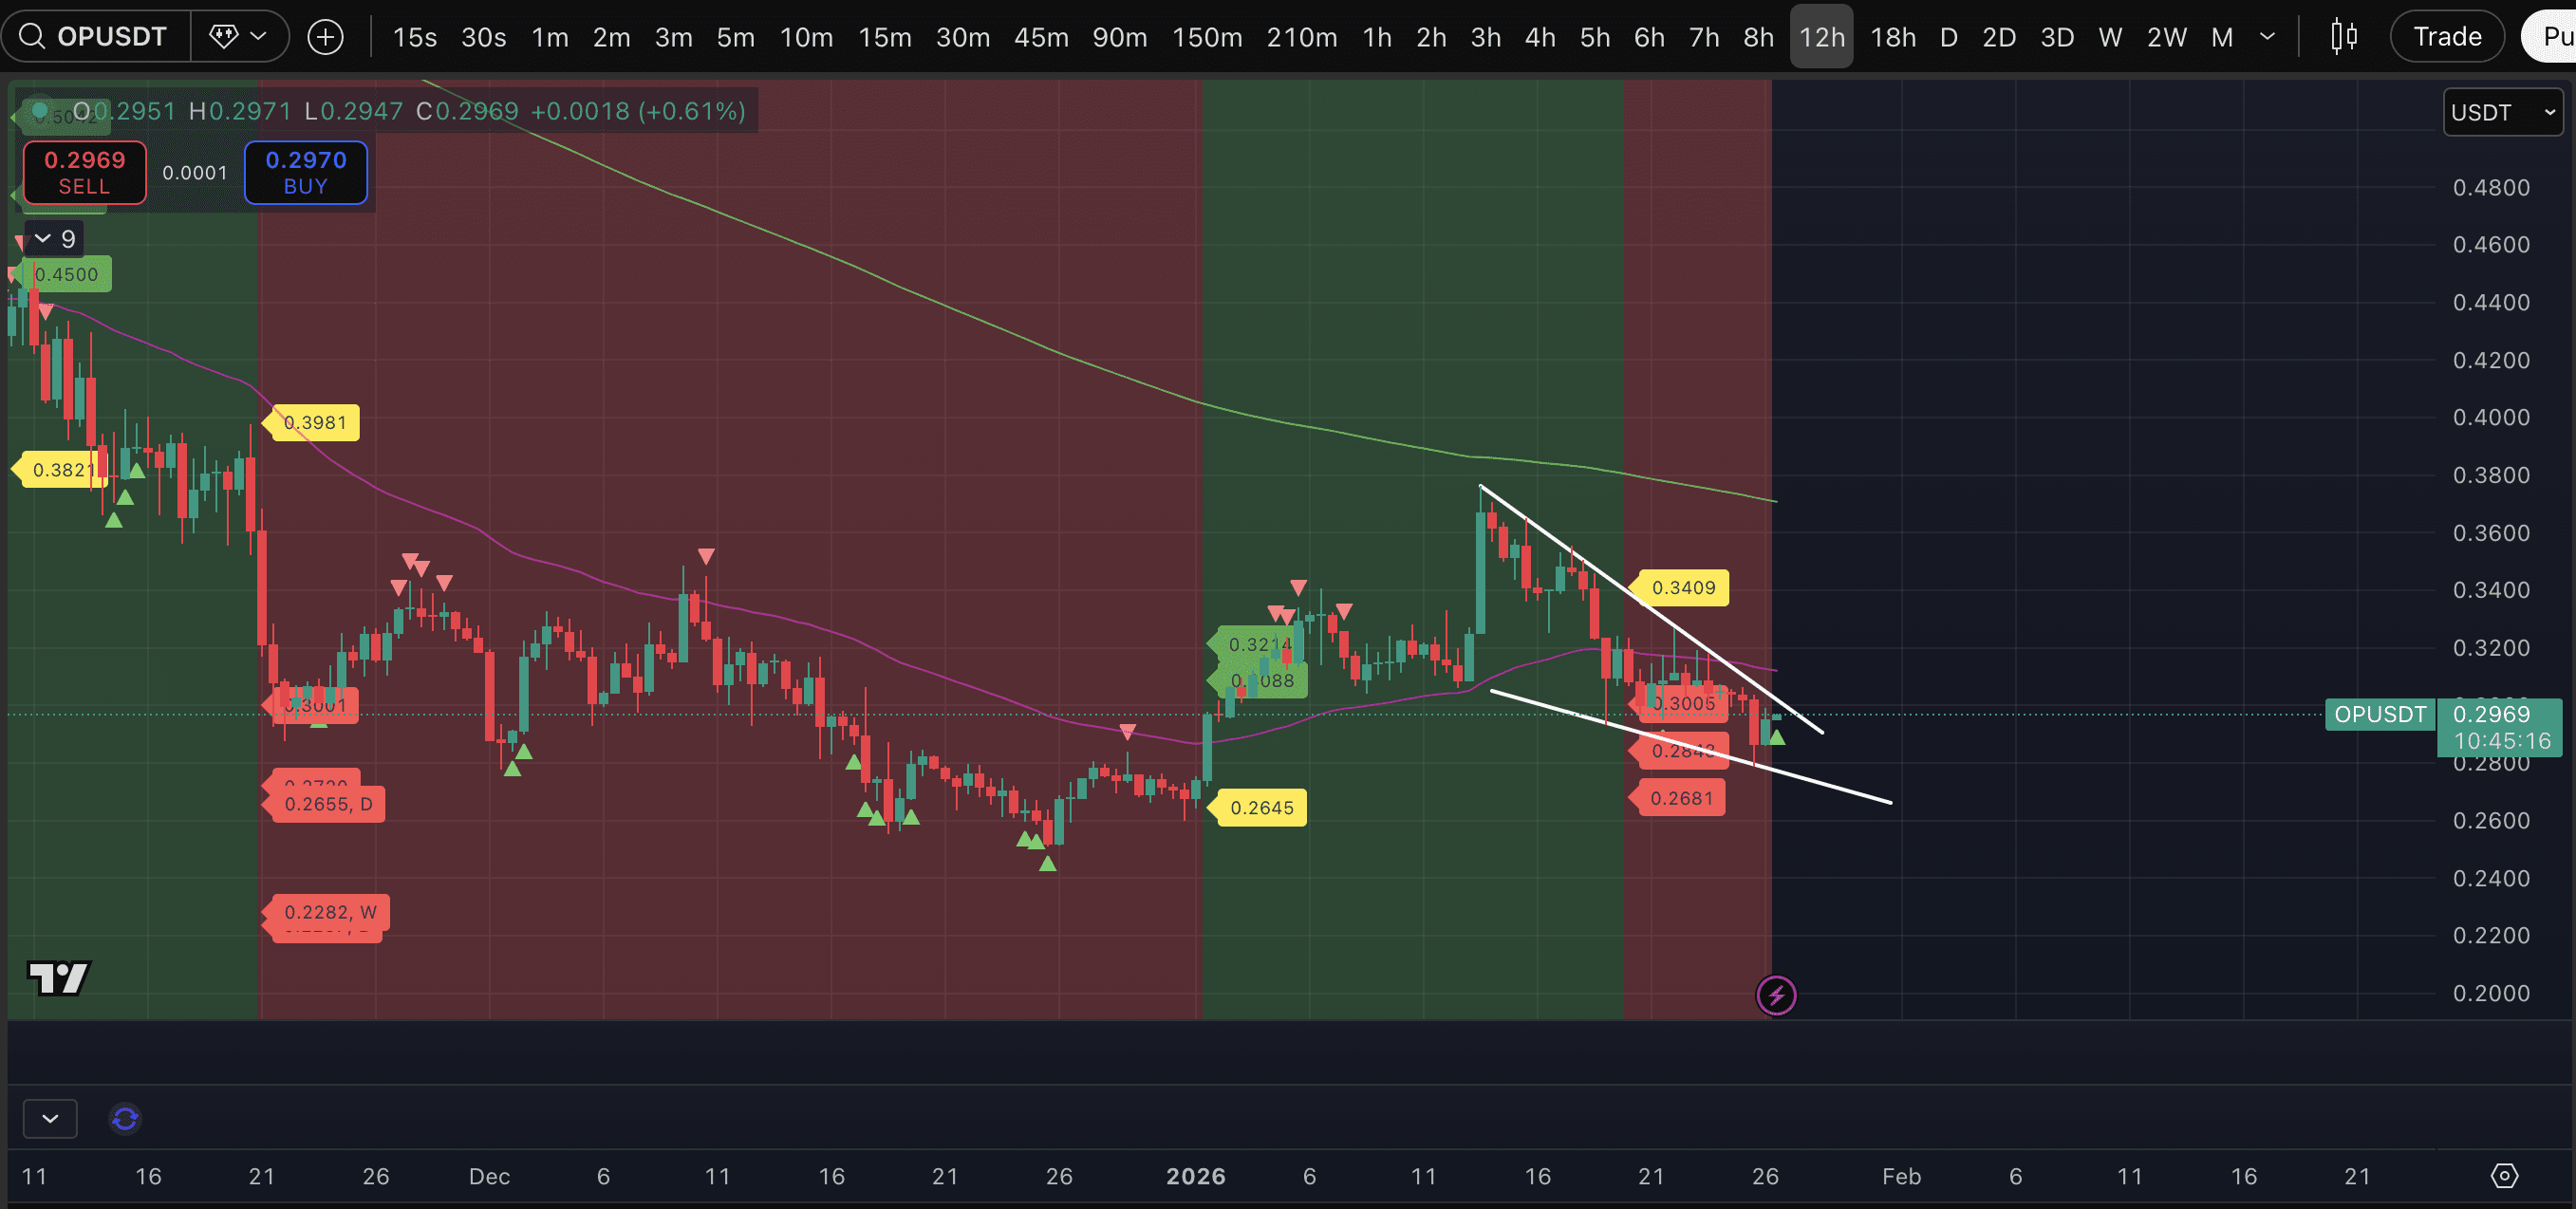
- #ON,
- #SUN,
- #TON,
- #TWT.
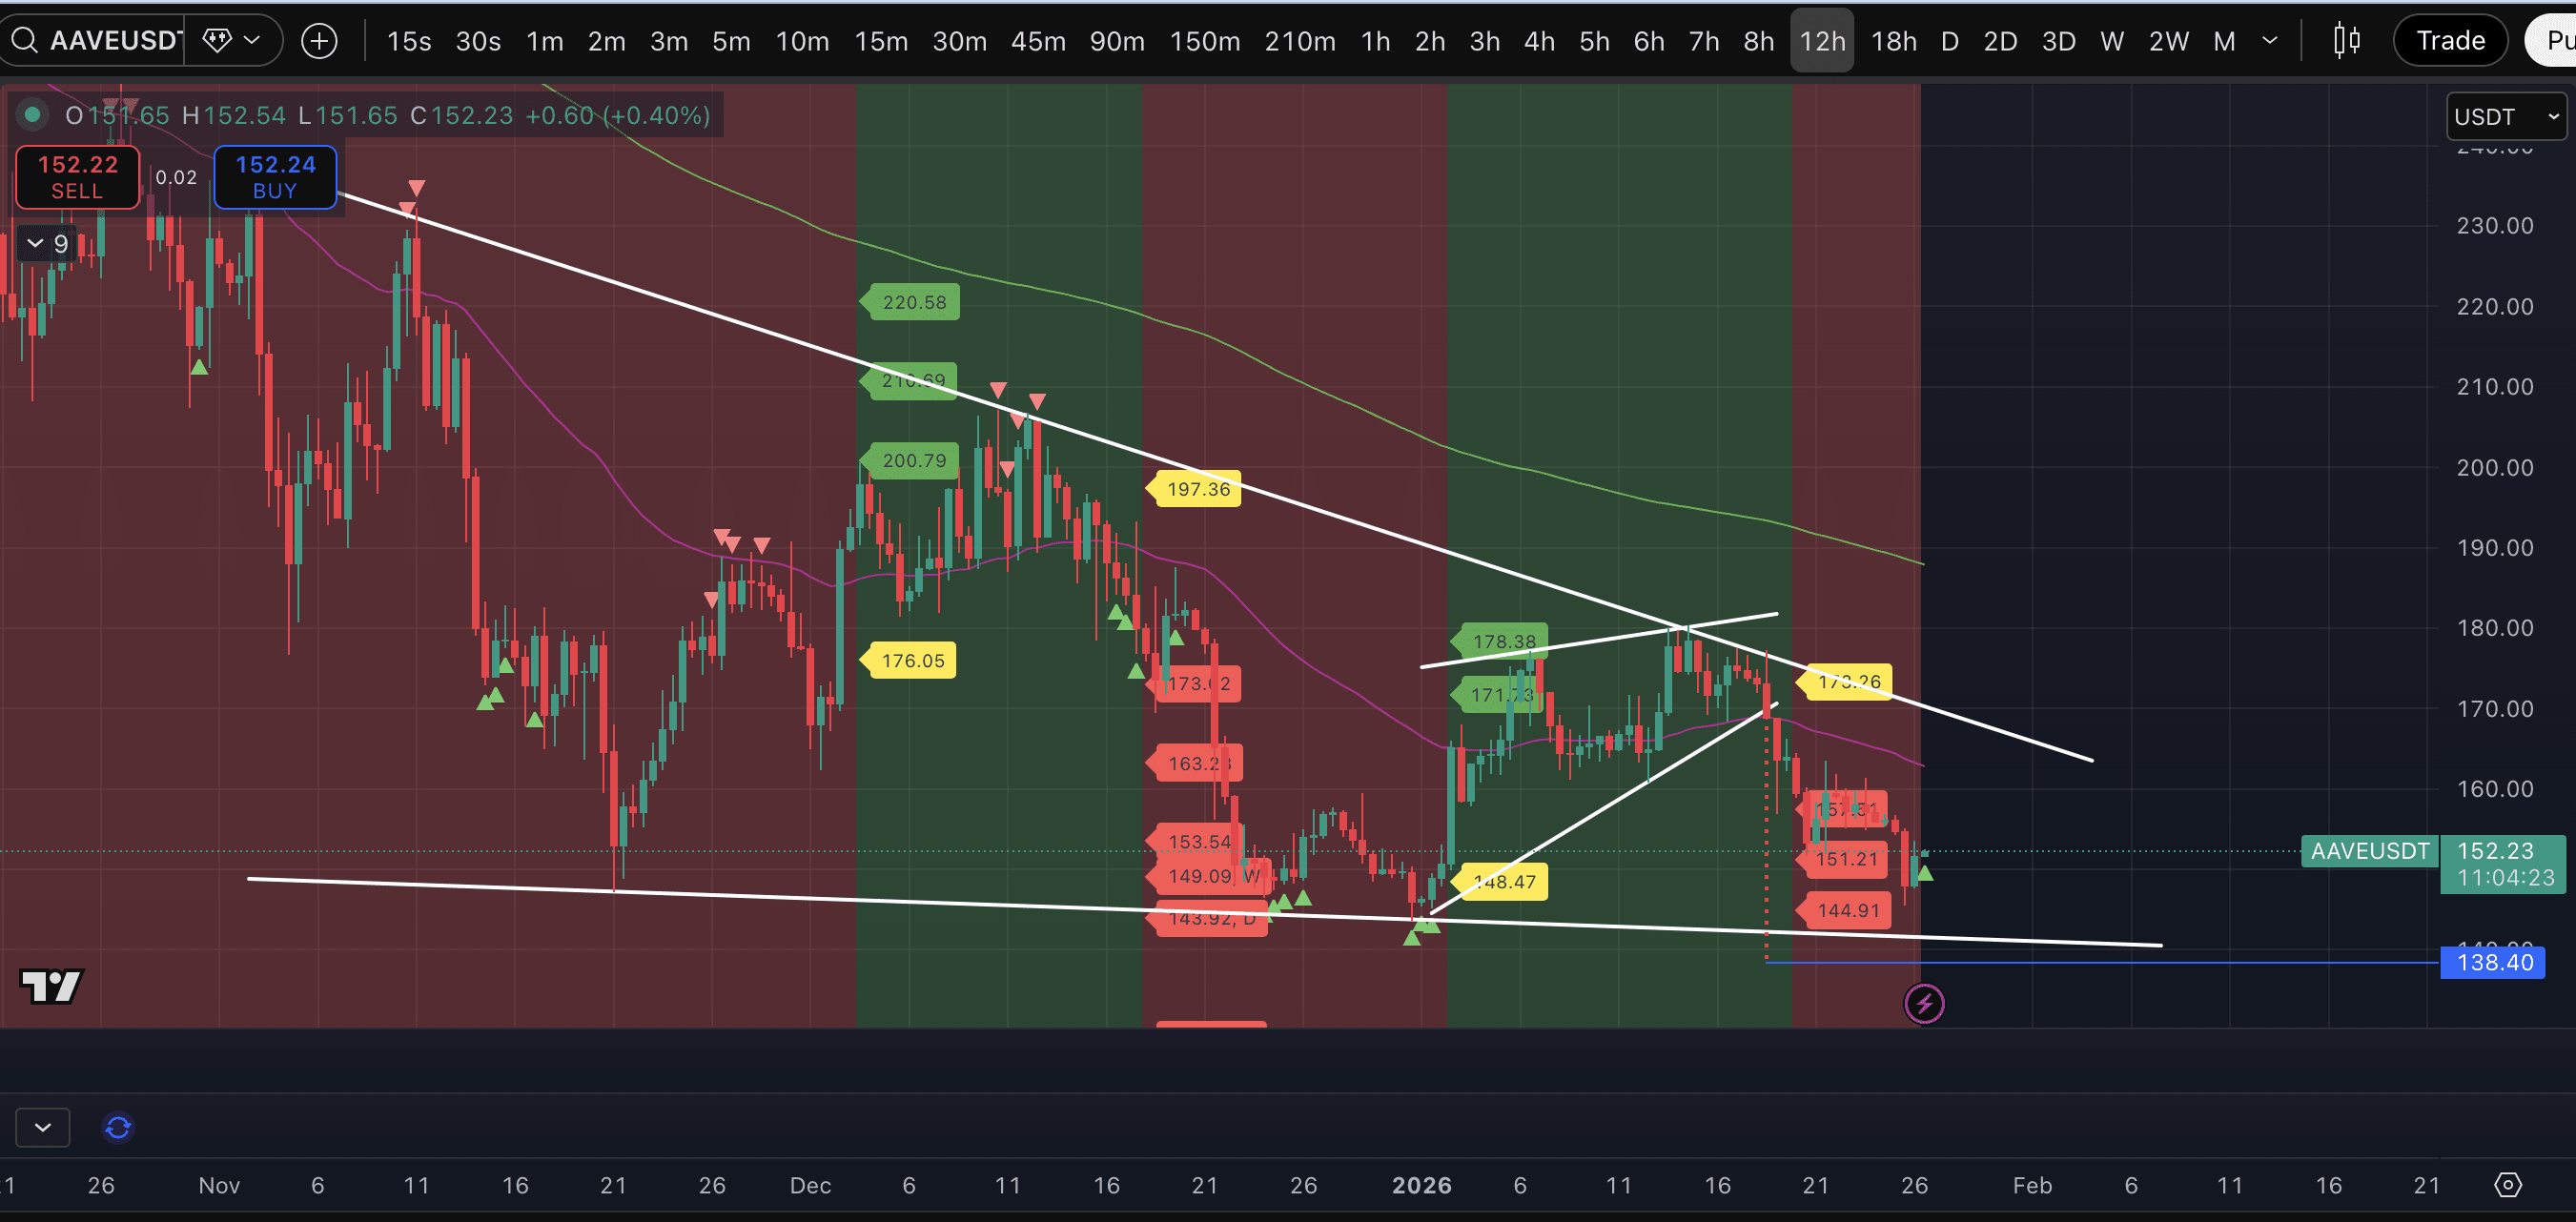
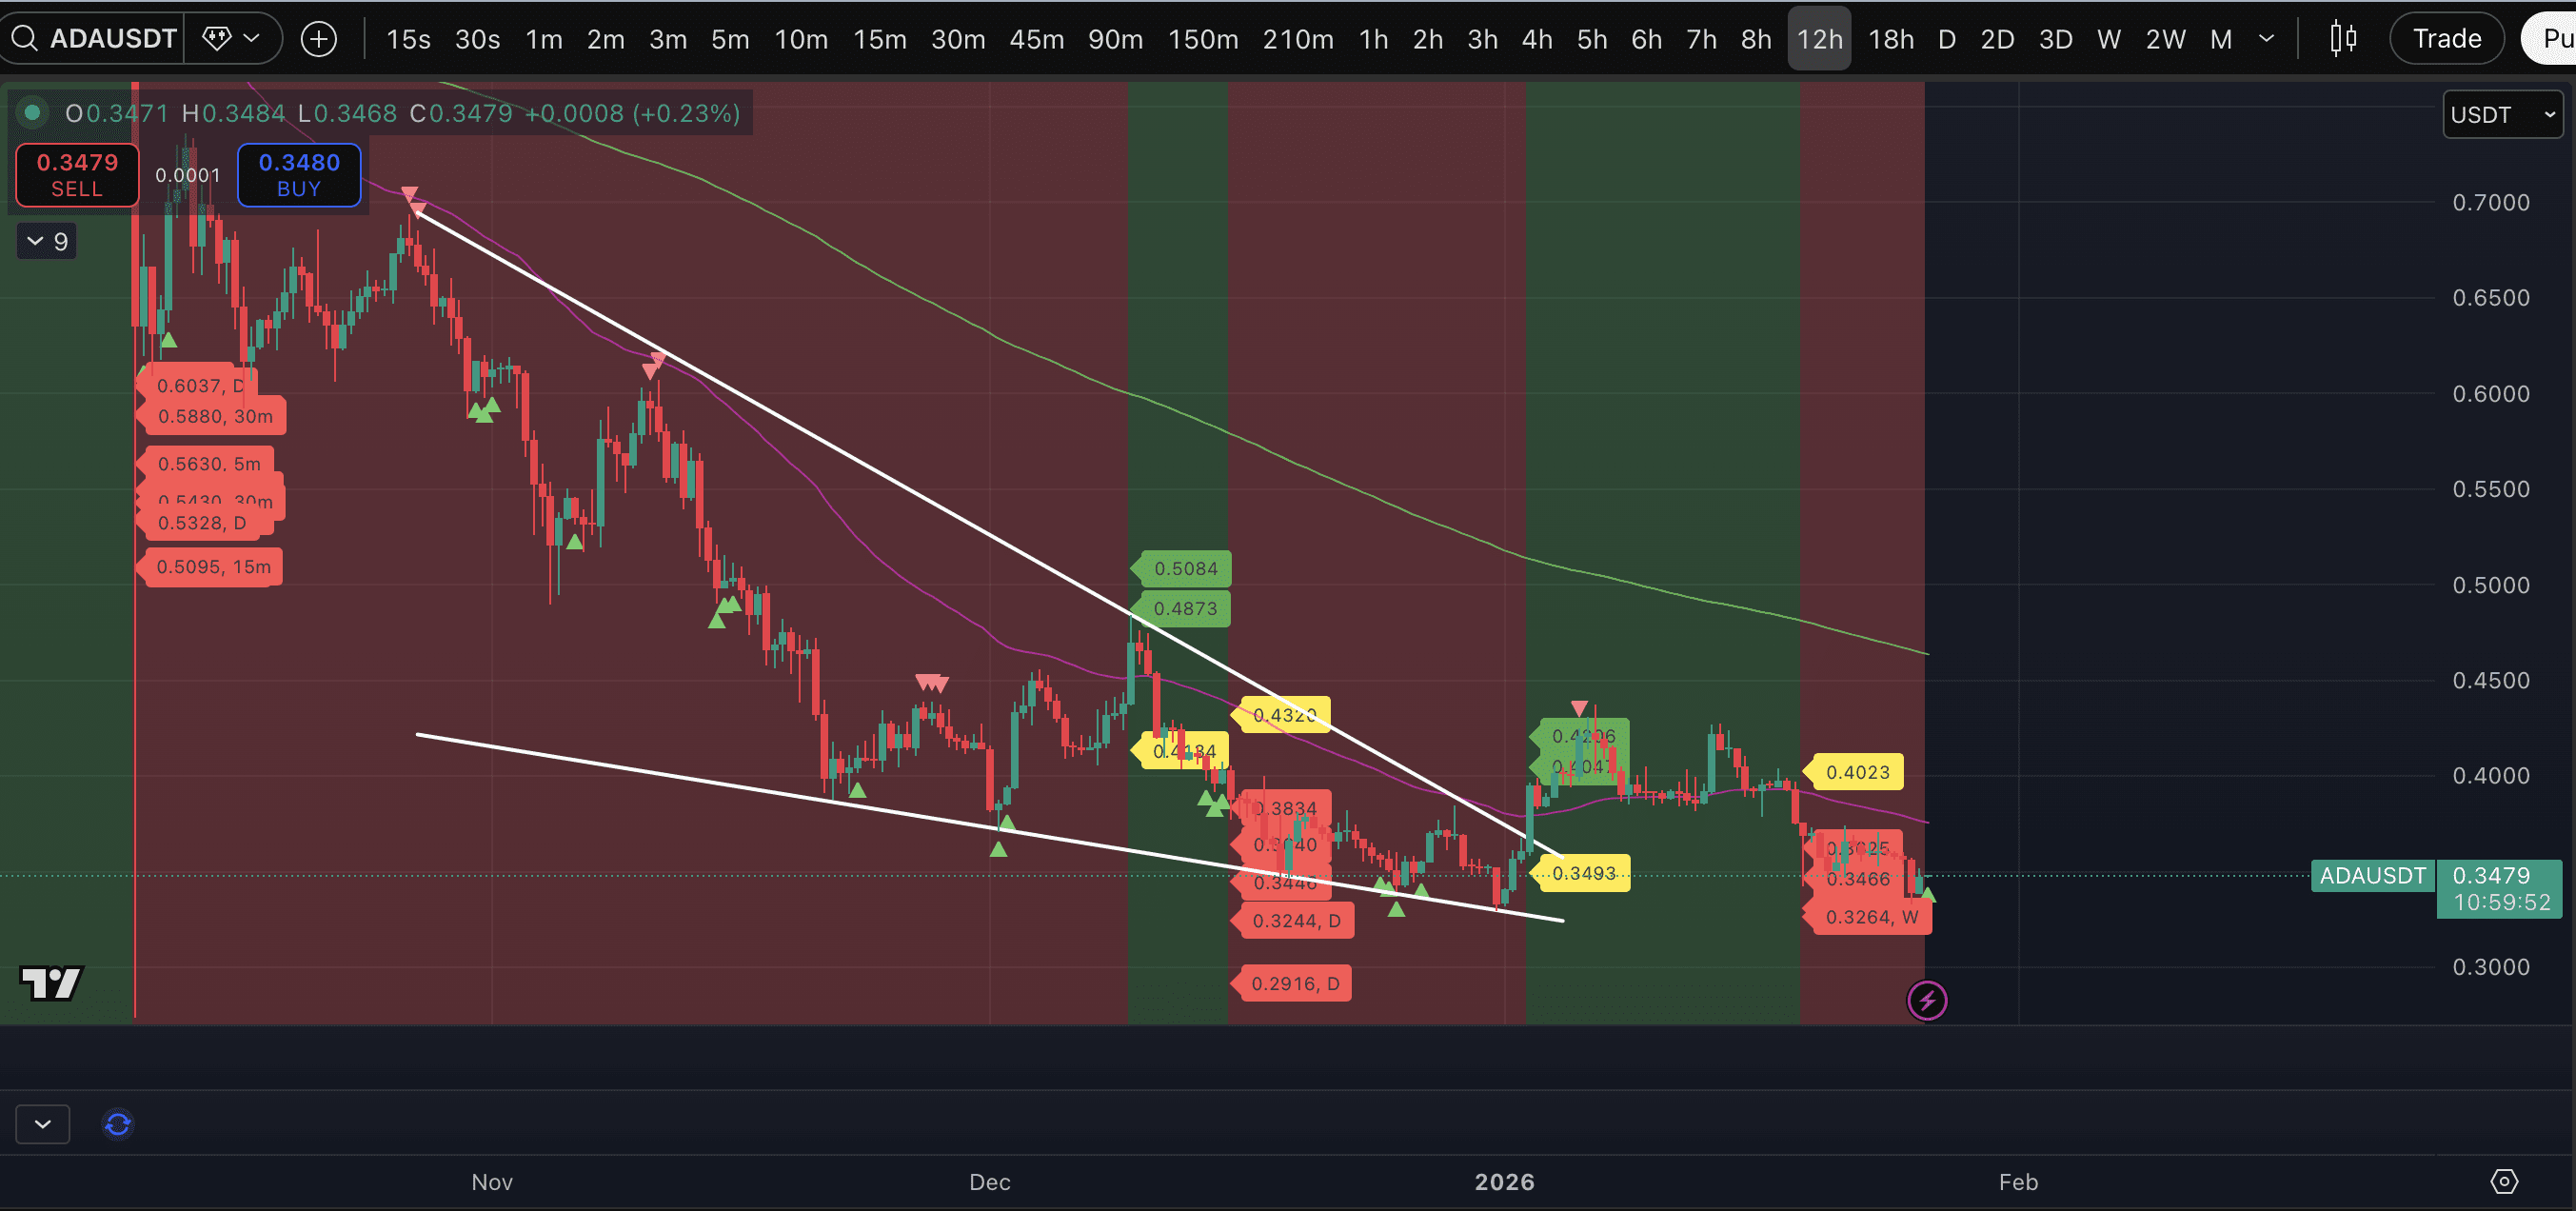
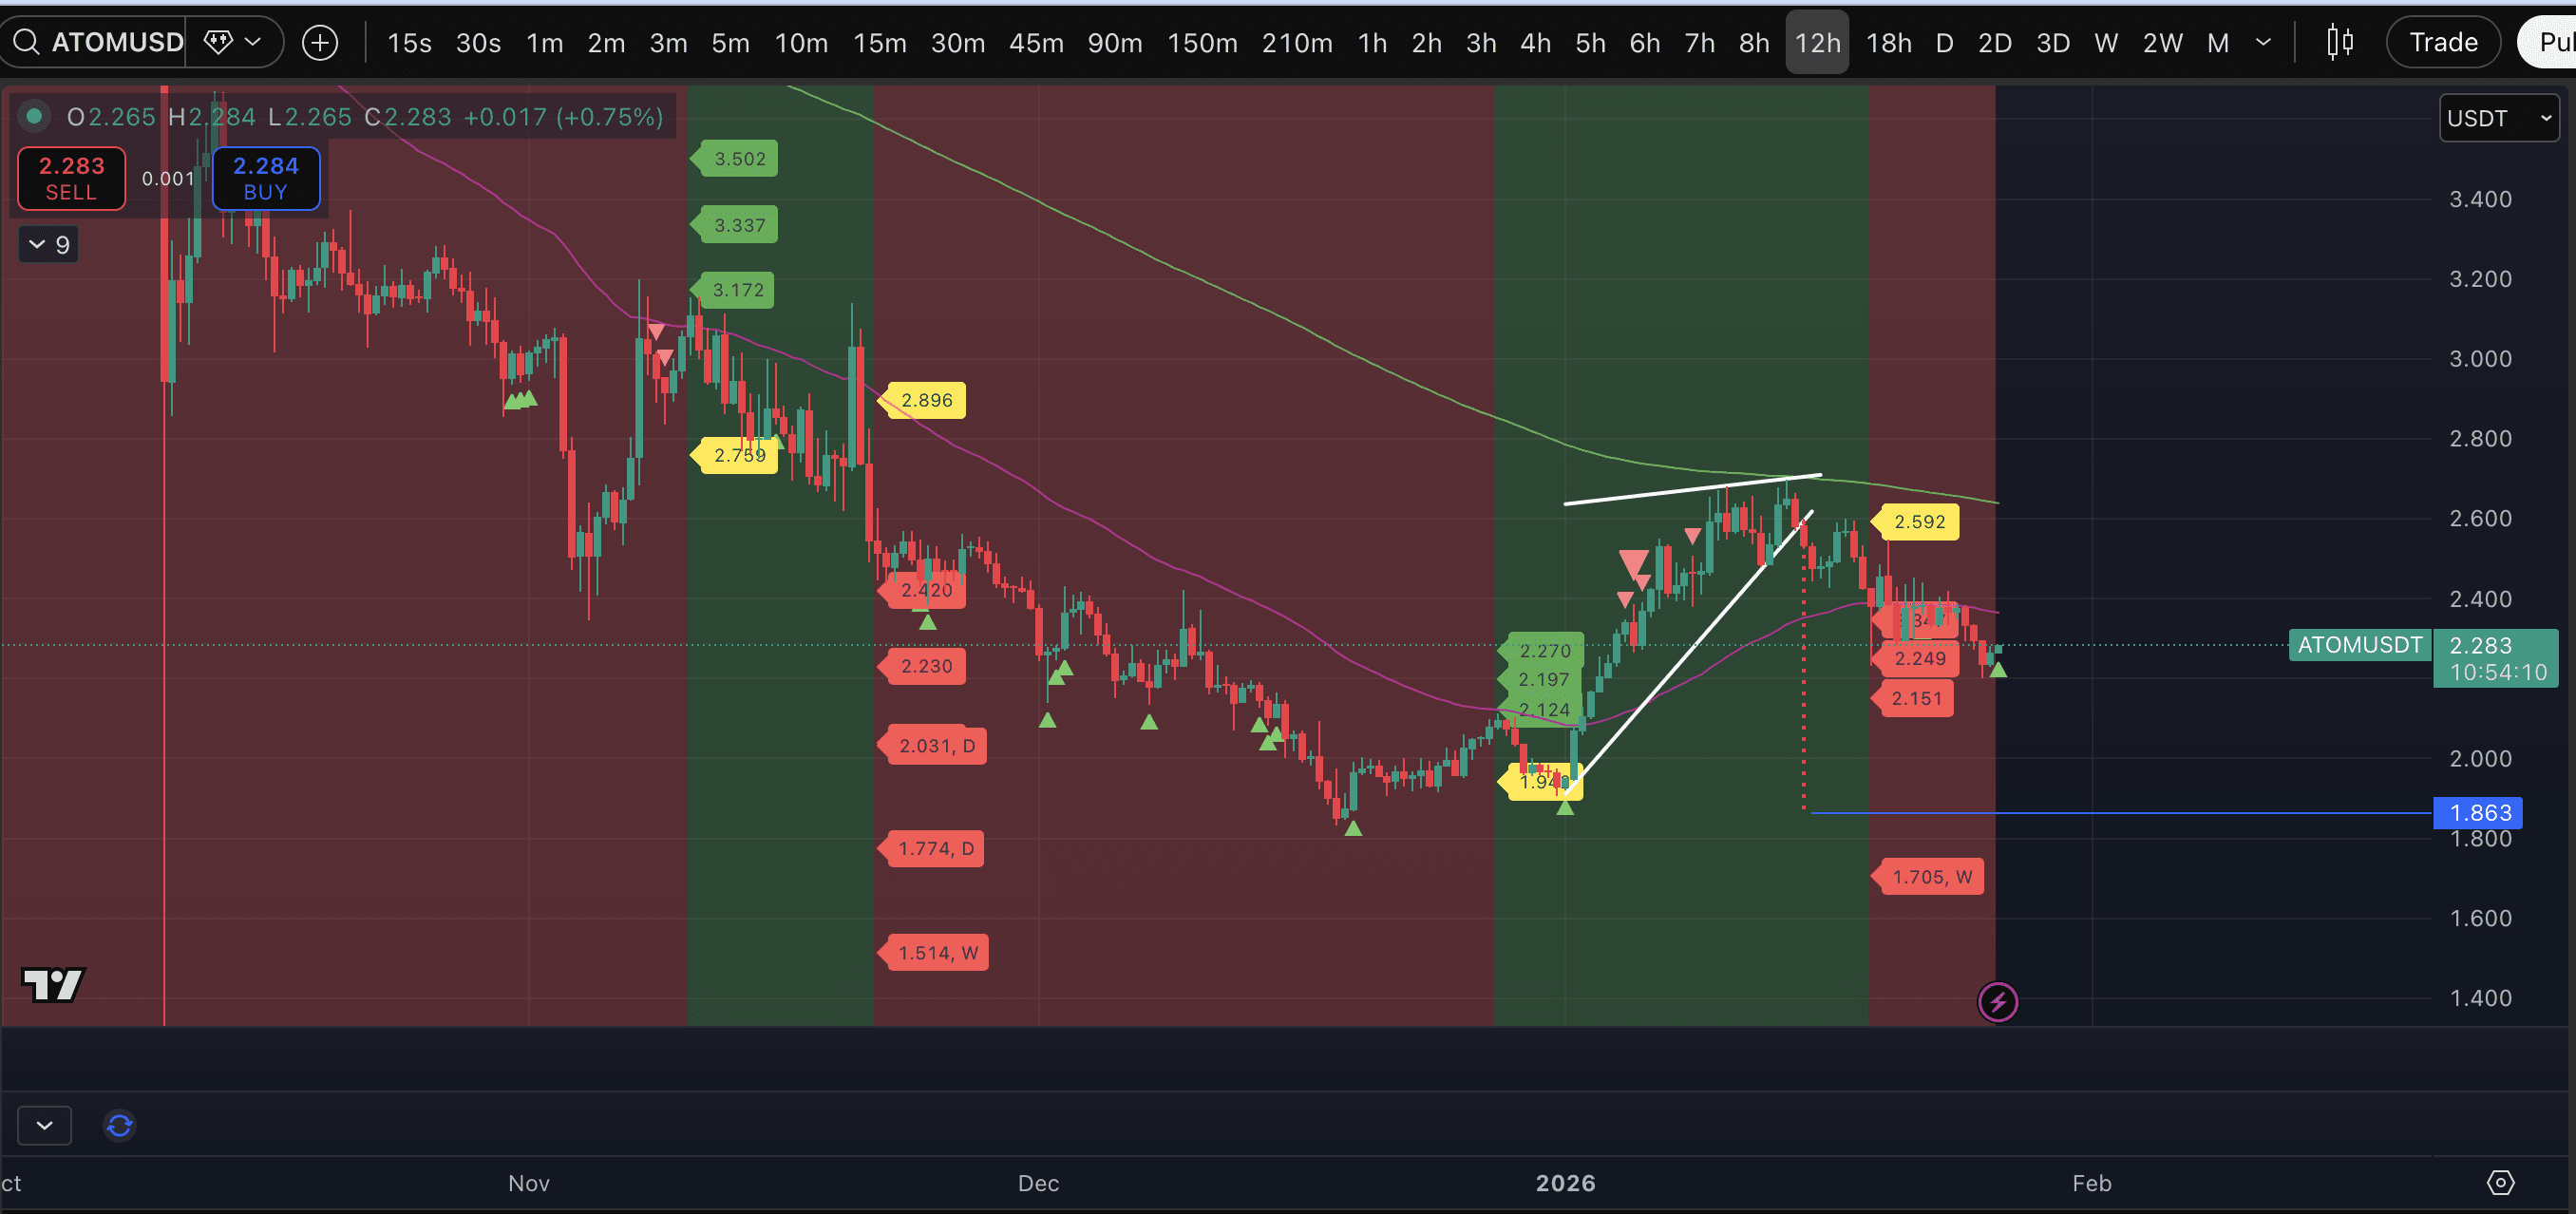
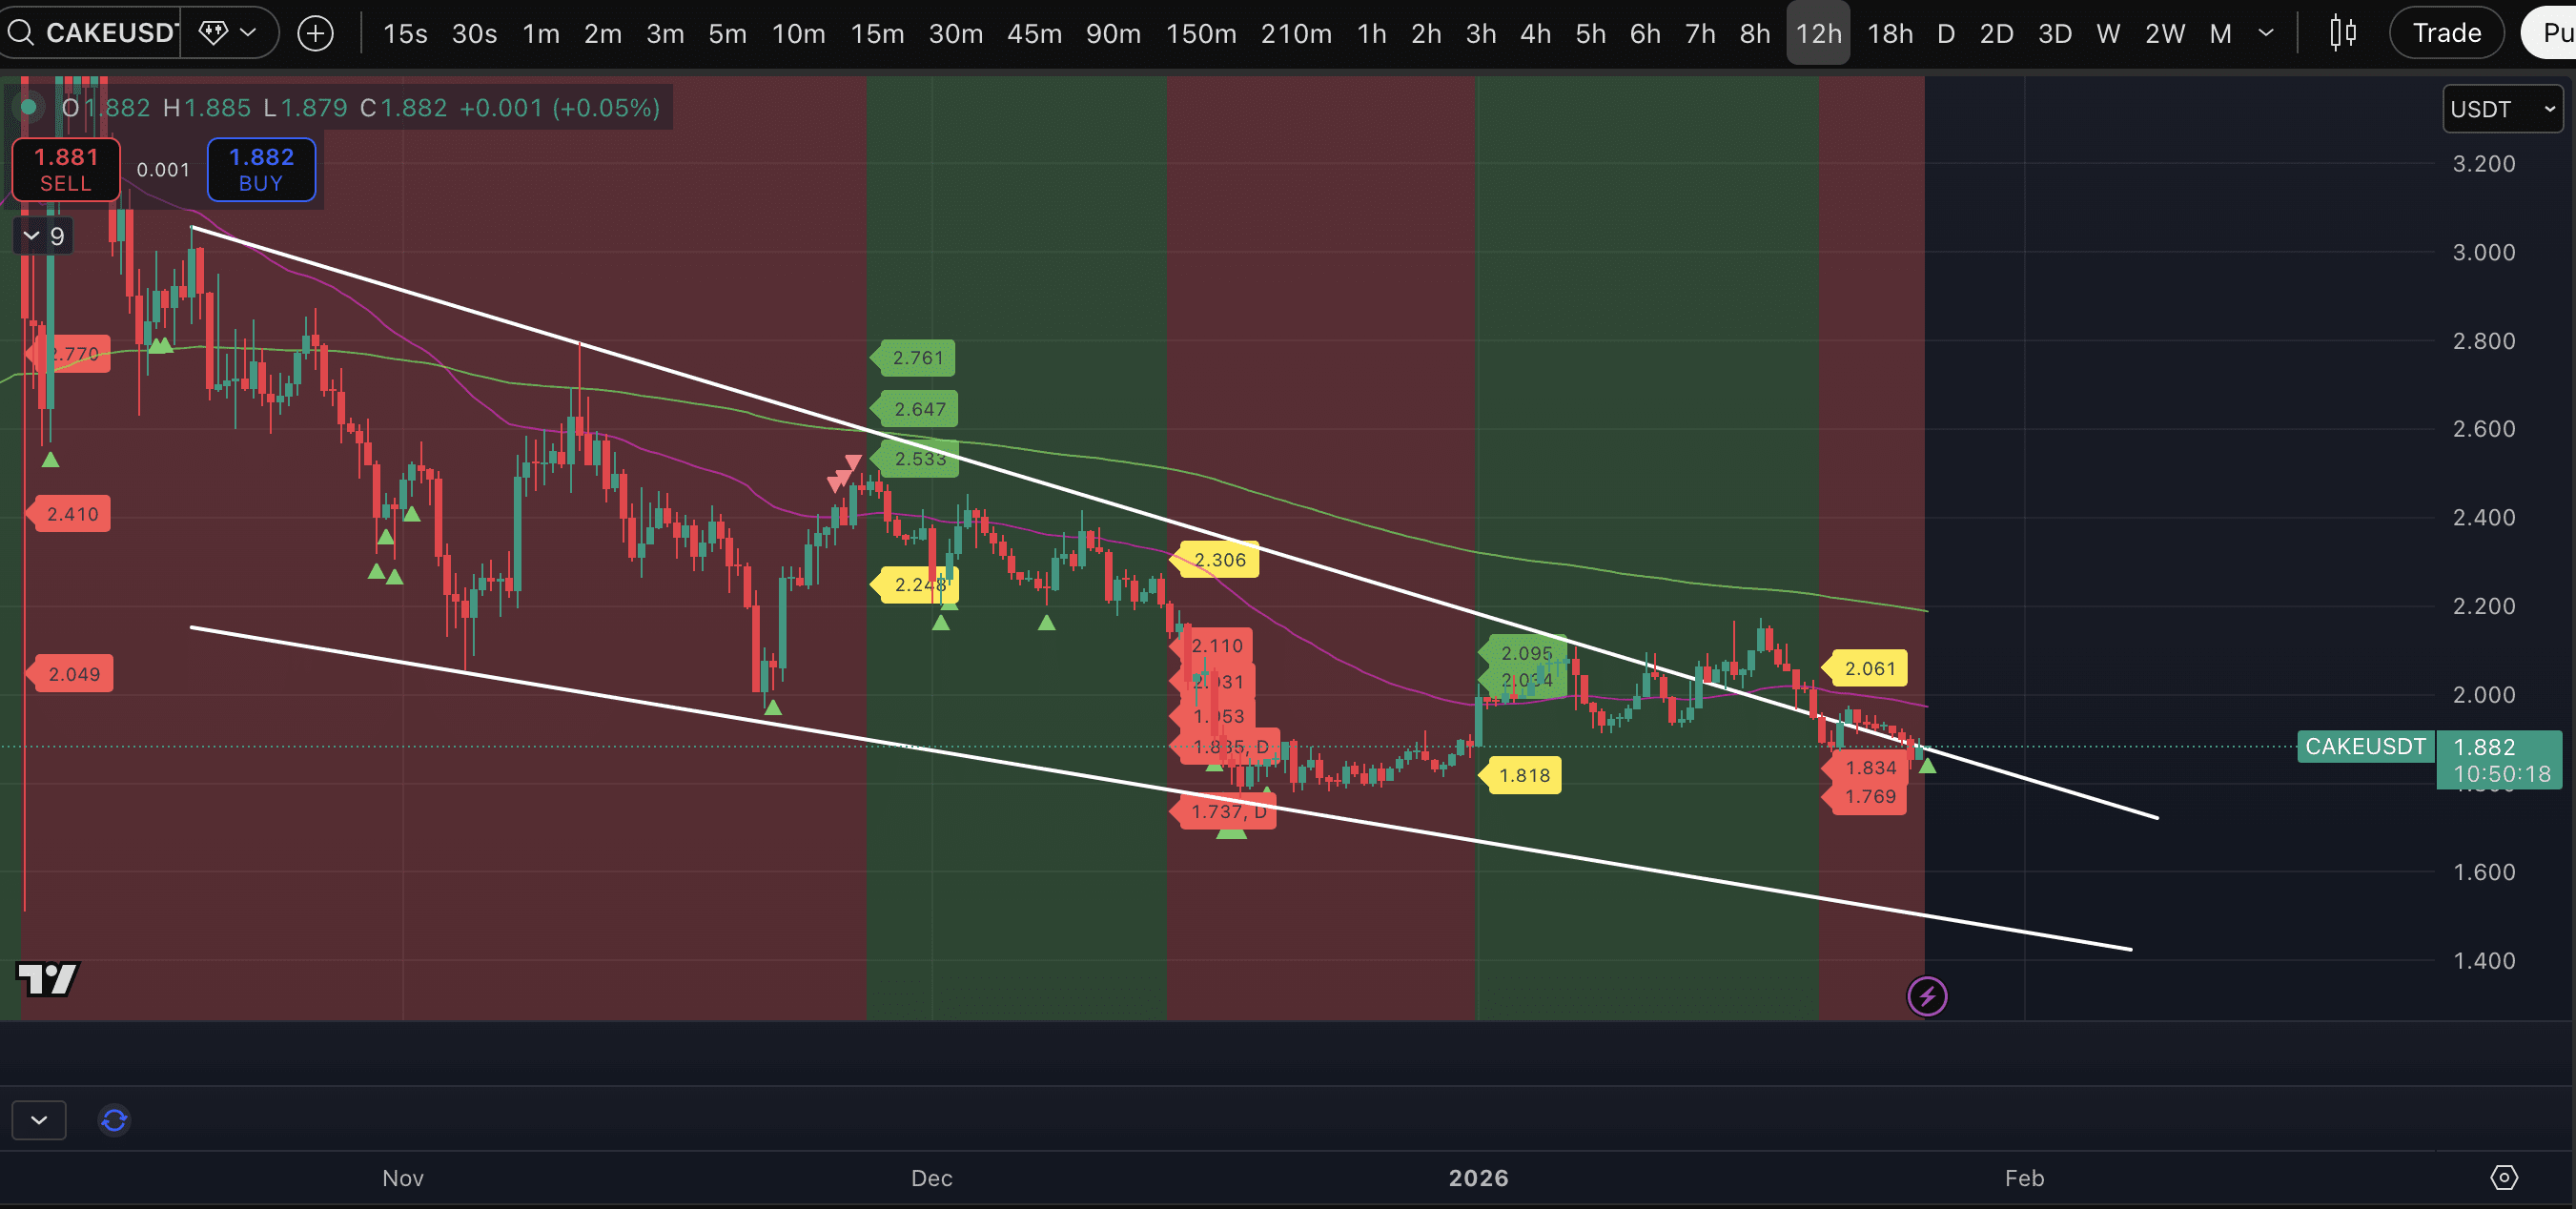
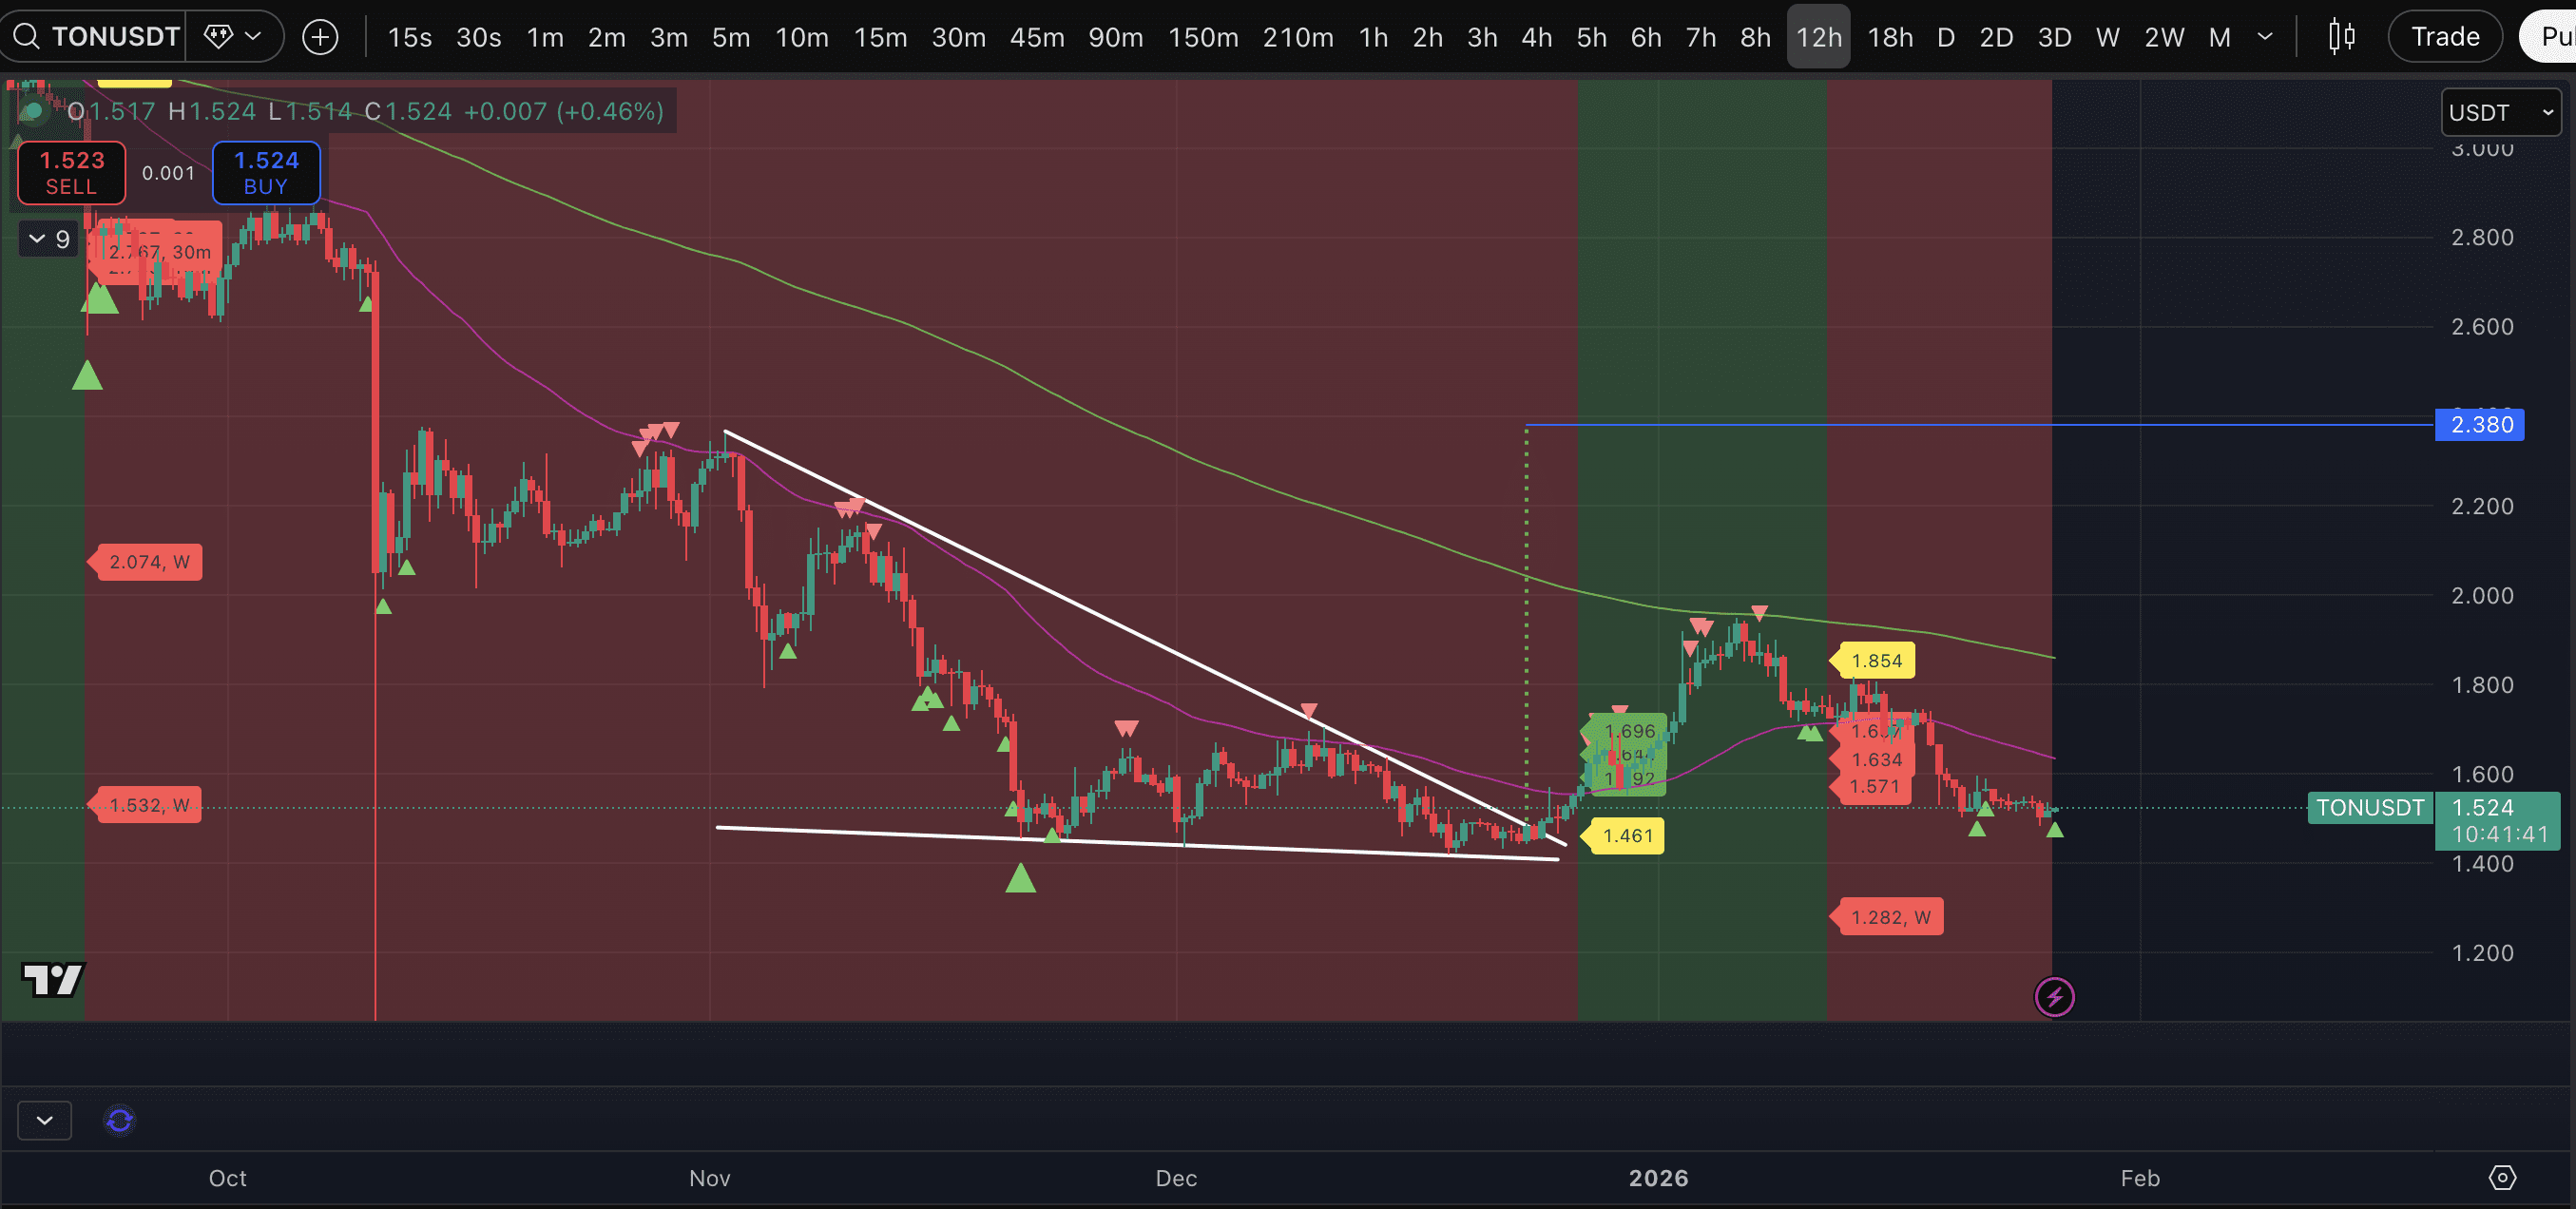
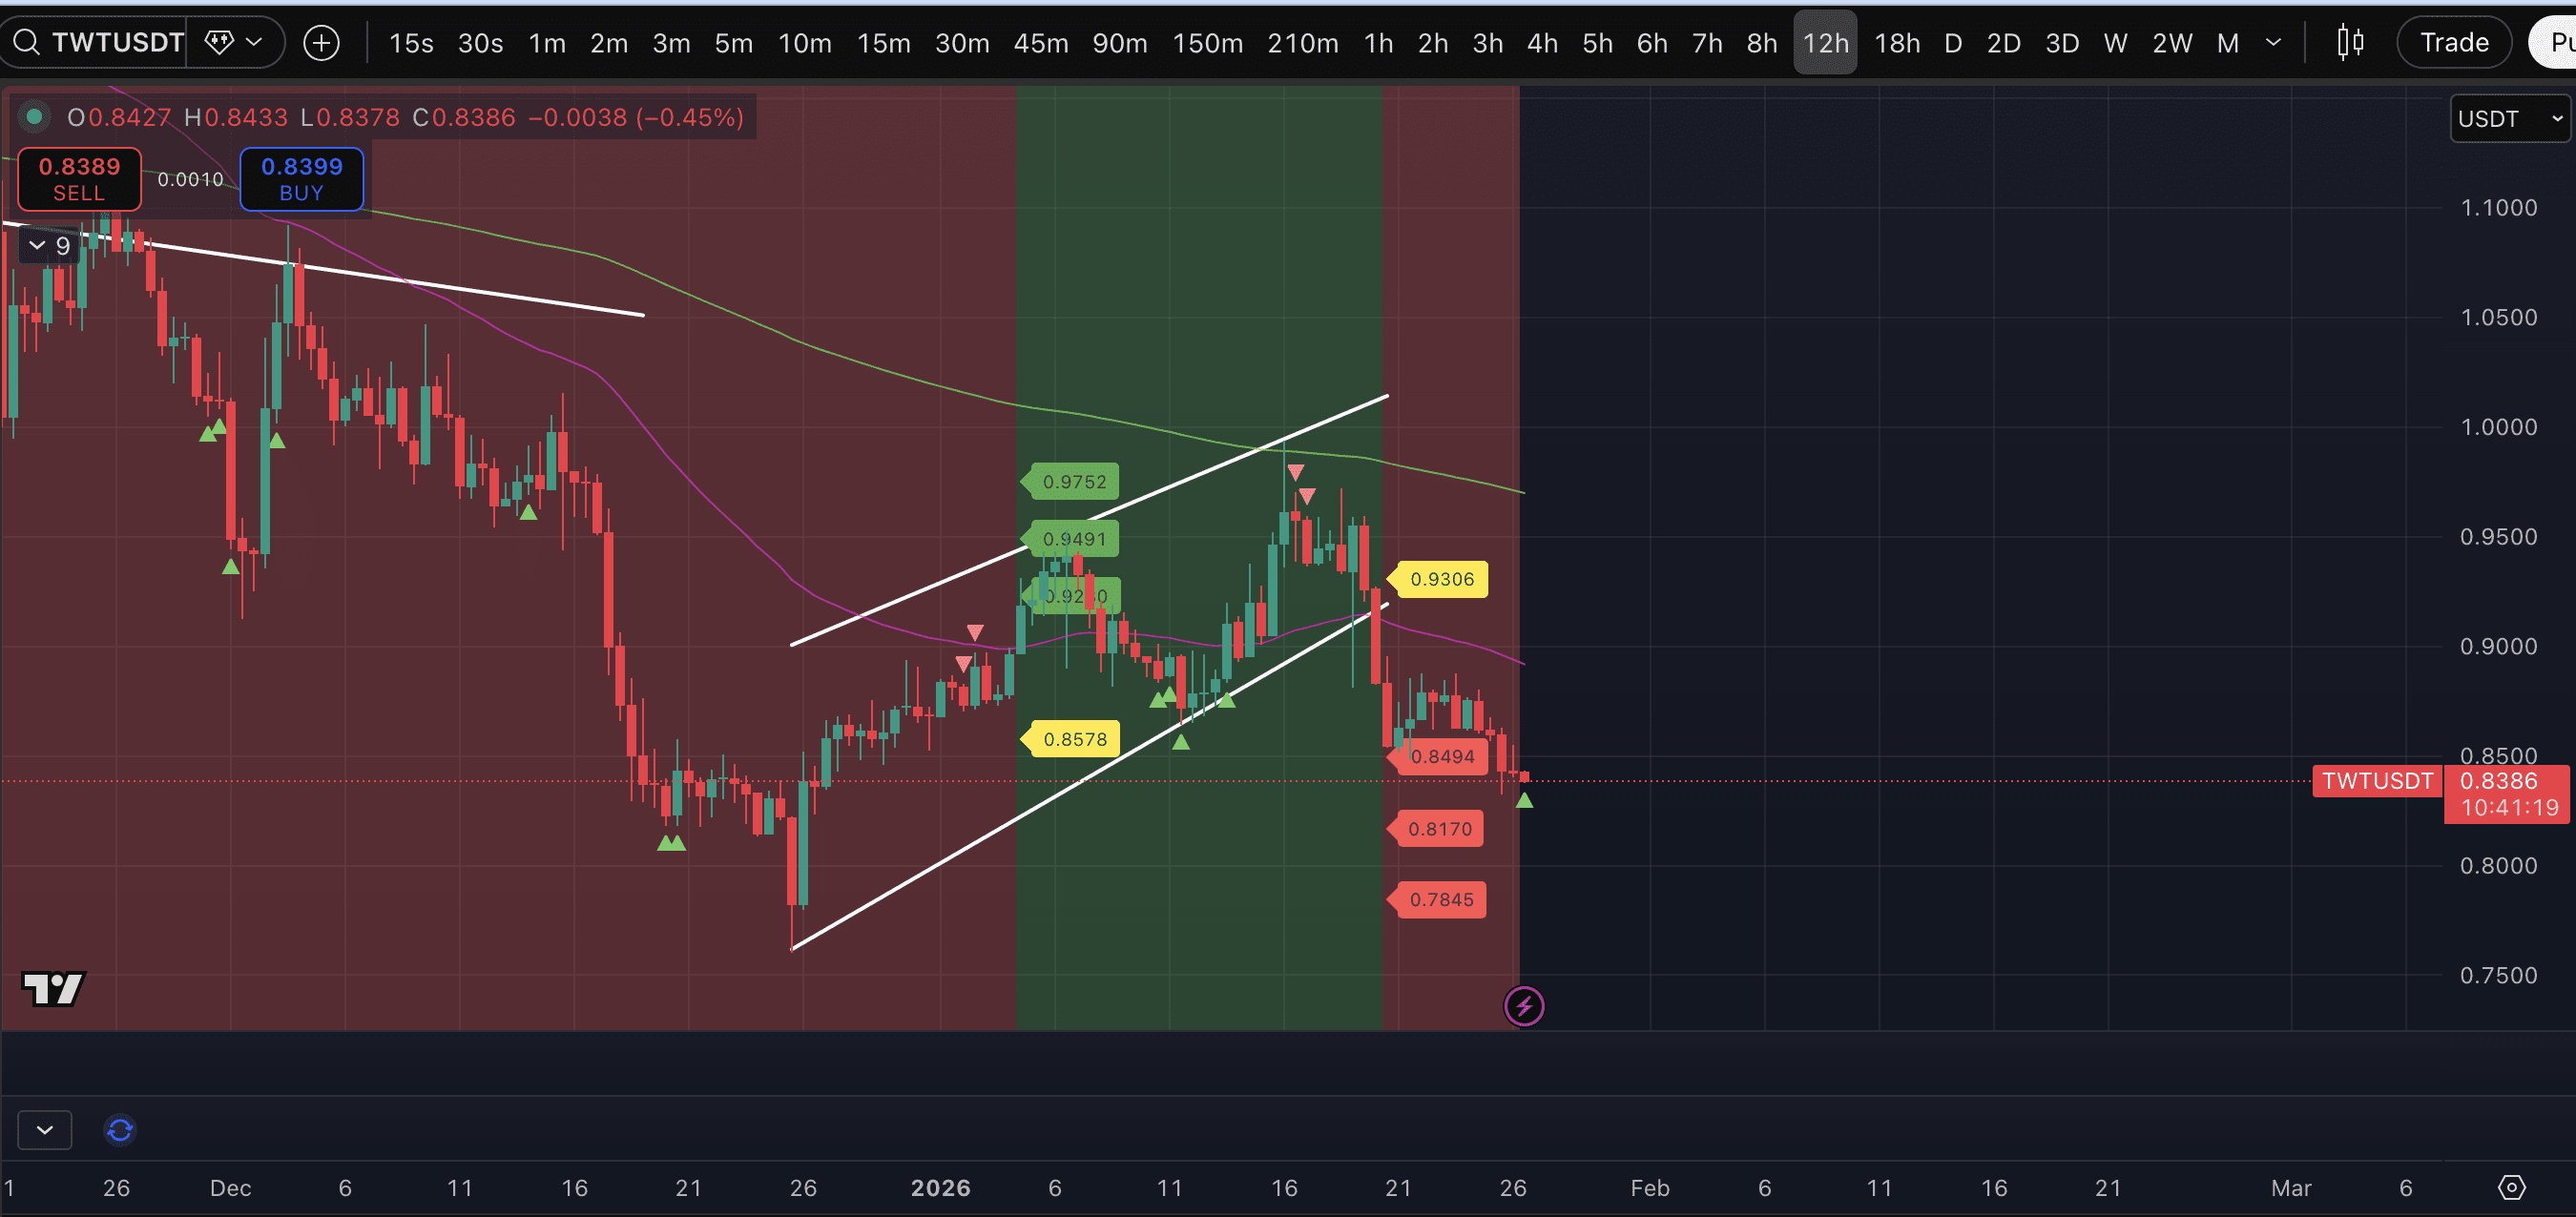
As you can see from the screenshots, all assets have several things in common:
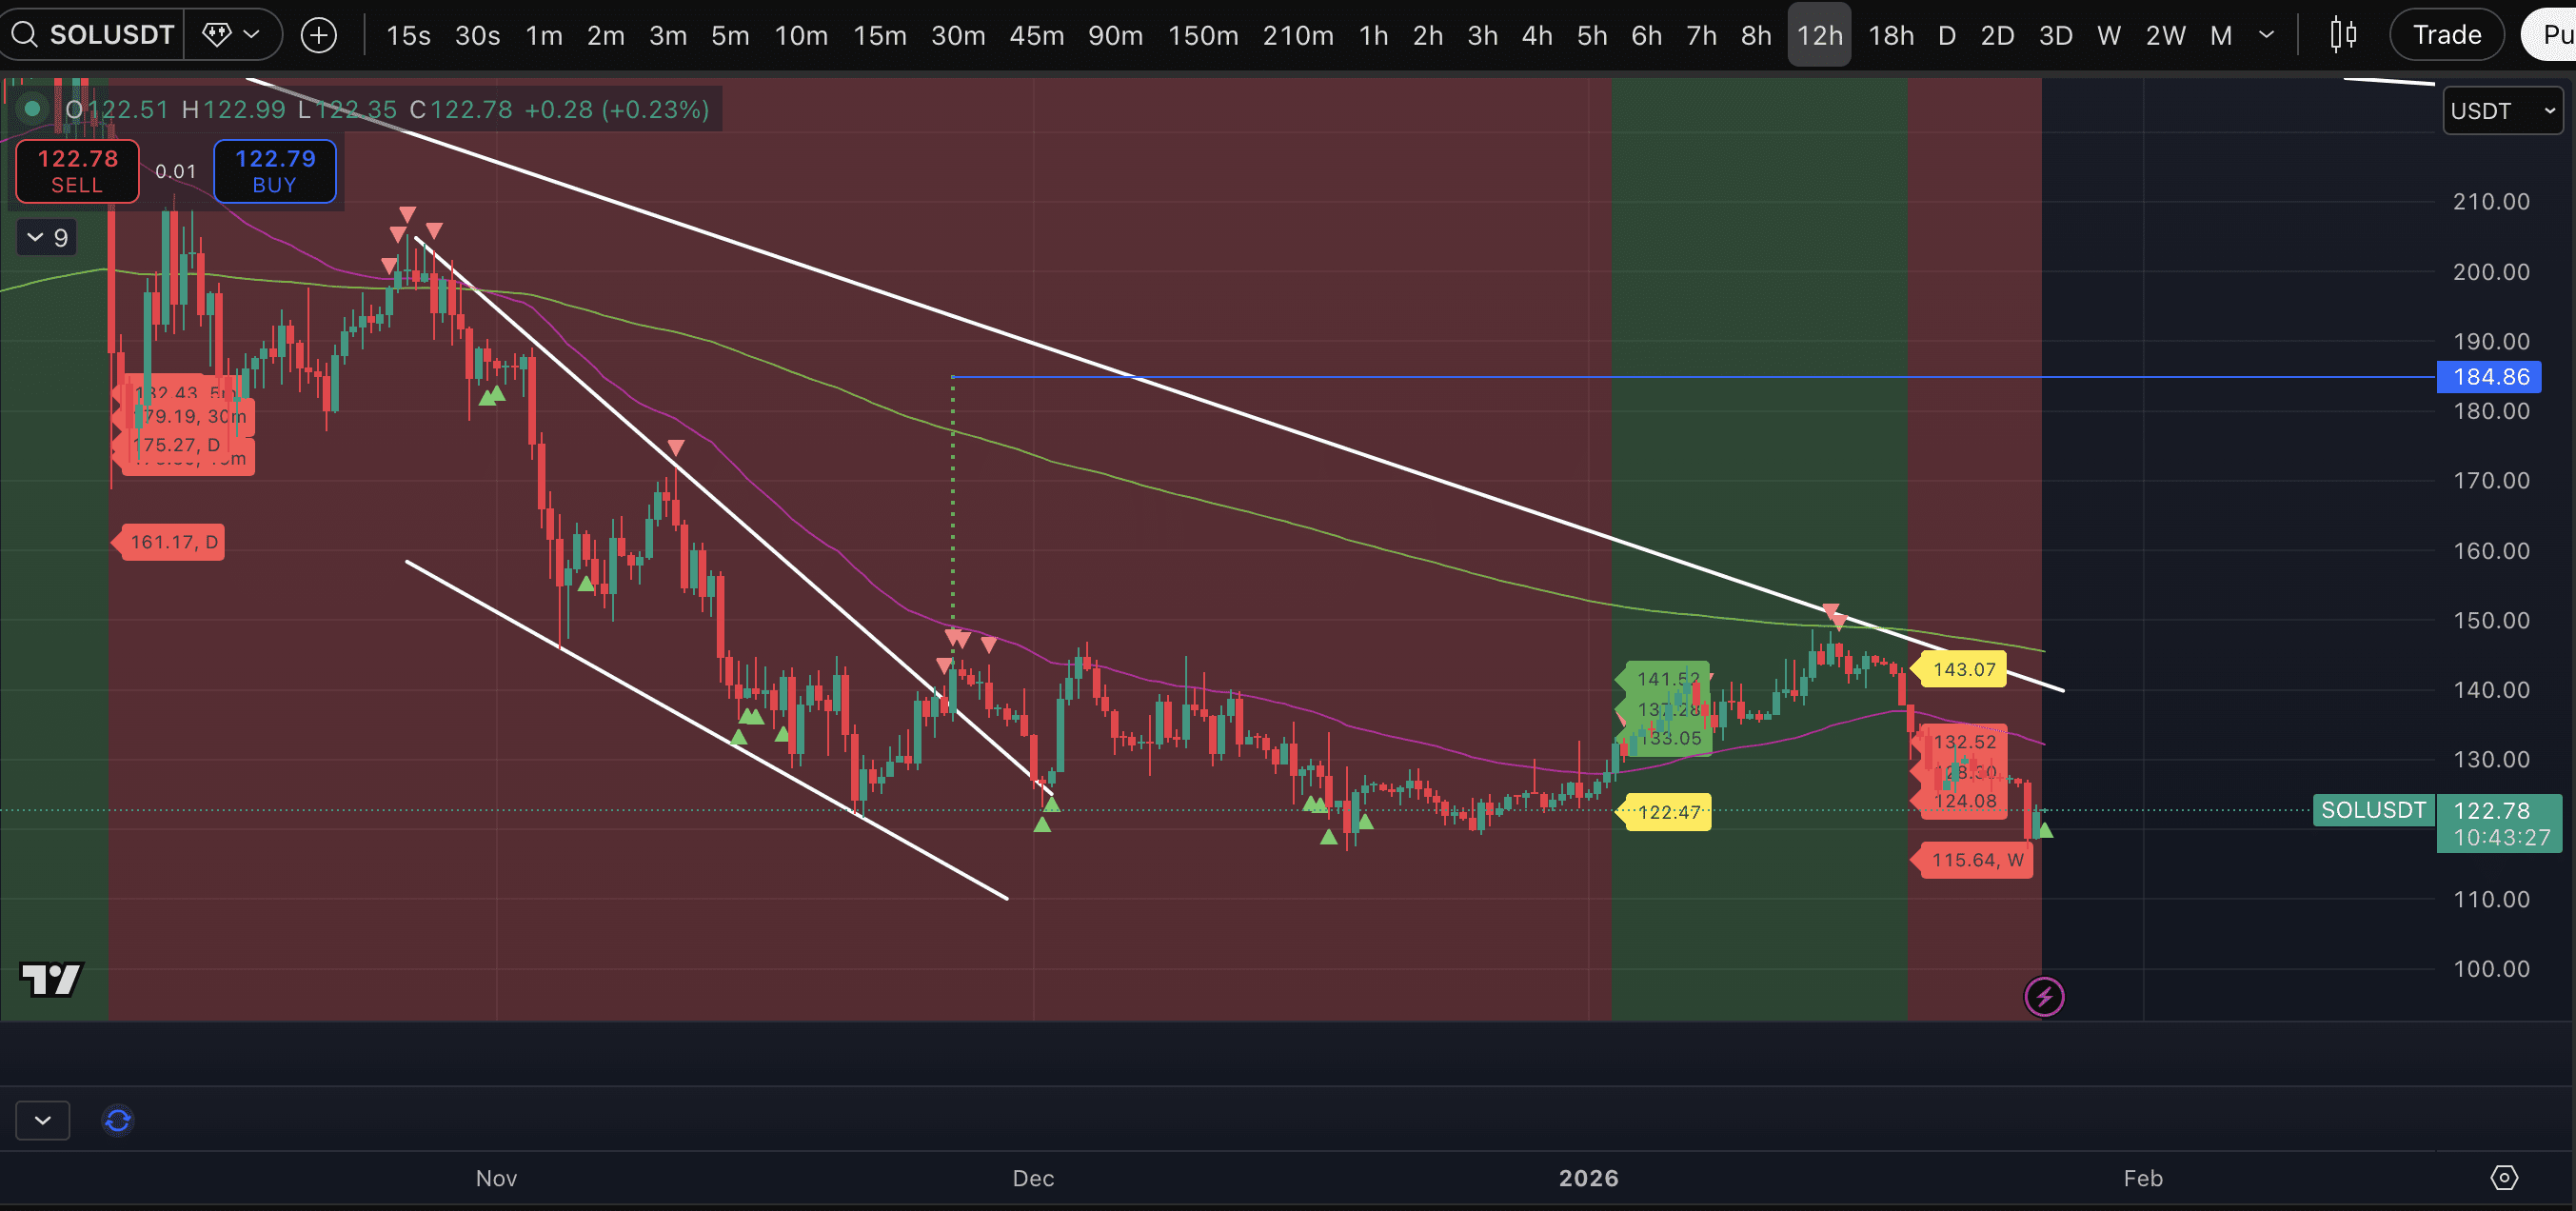
- Assets are in a stable downtrend on the 12-hour timeframe, and many of them have not yet fully reached their basic downtrend targets.
- Some assets are working through the "Bearish Wedge" pattern, which formed in January and has not yet fully developed.
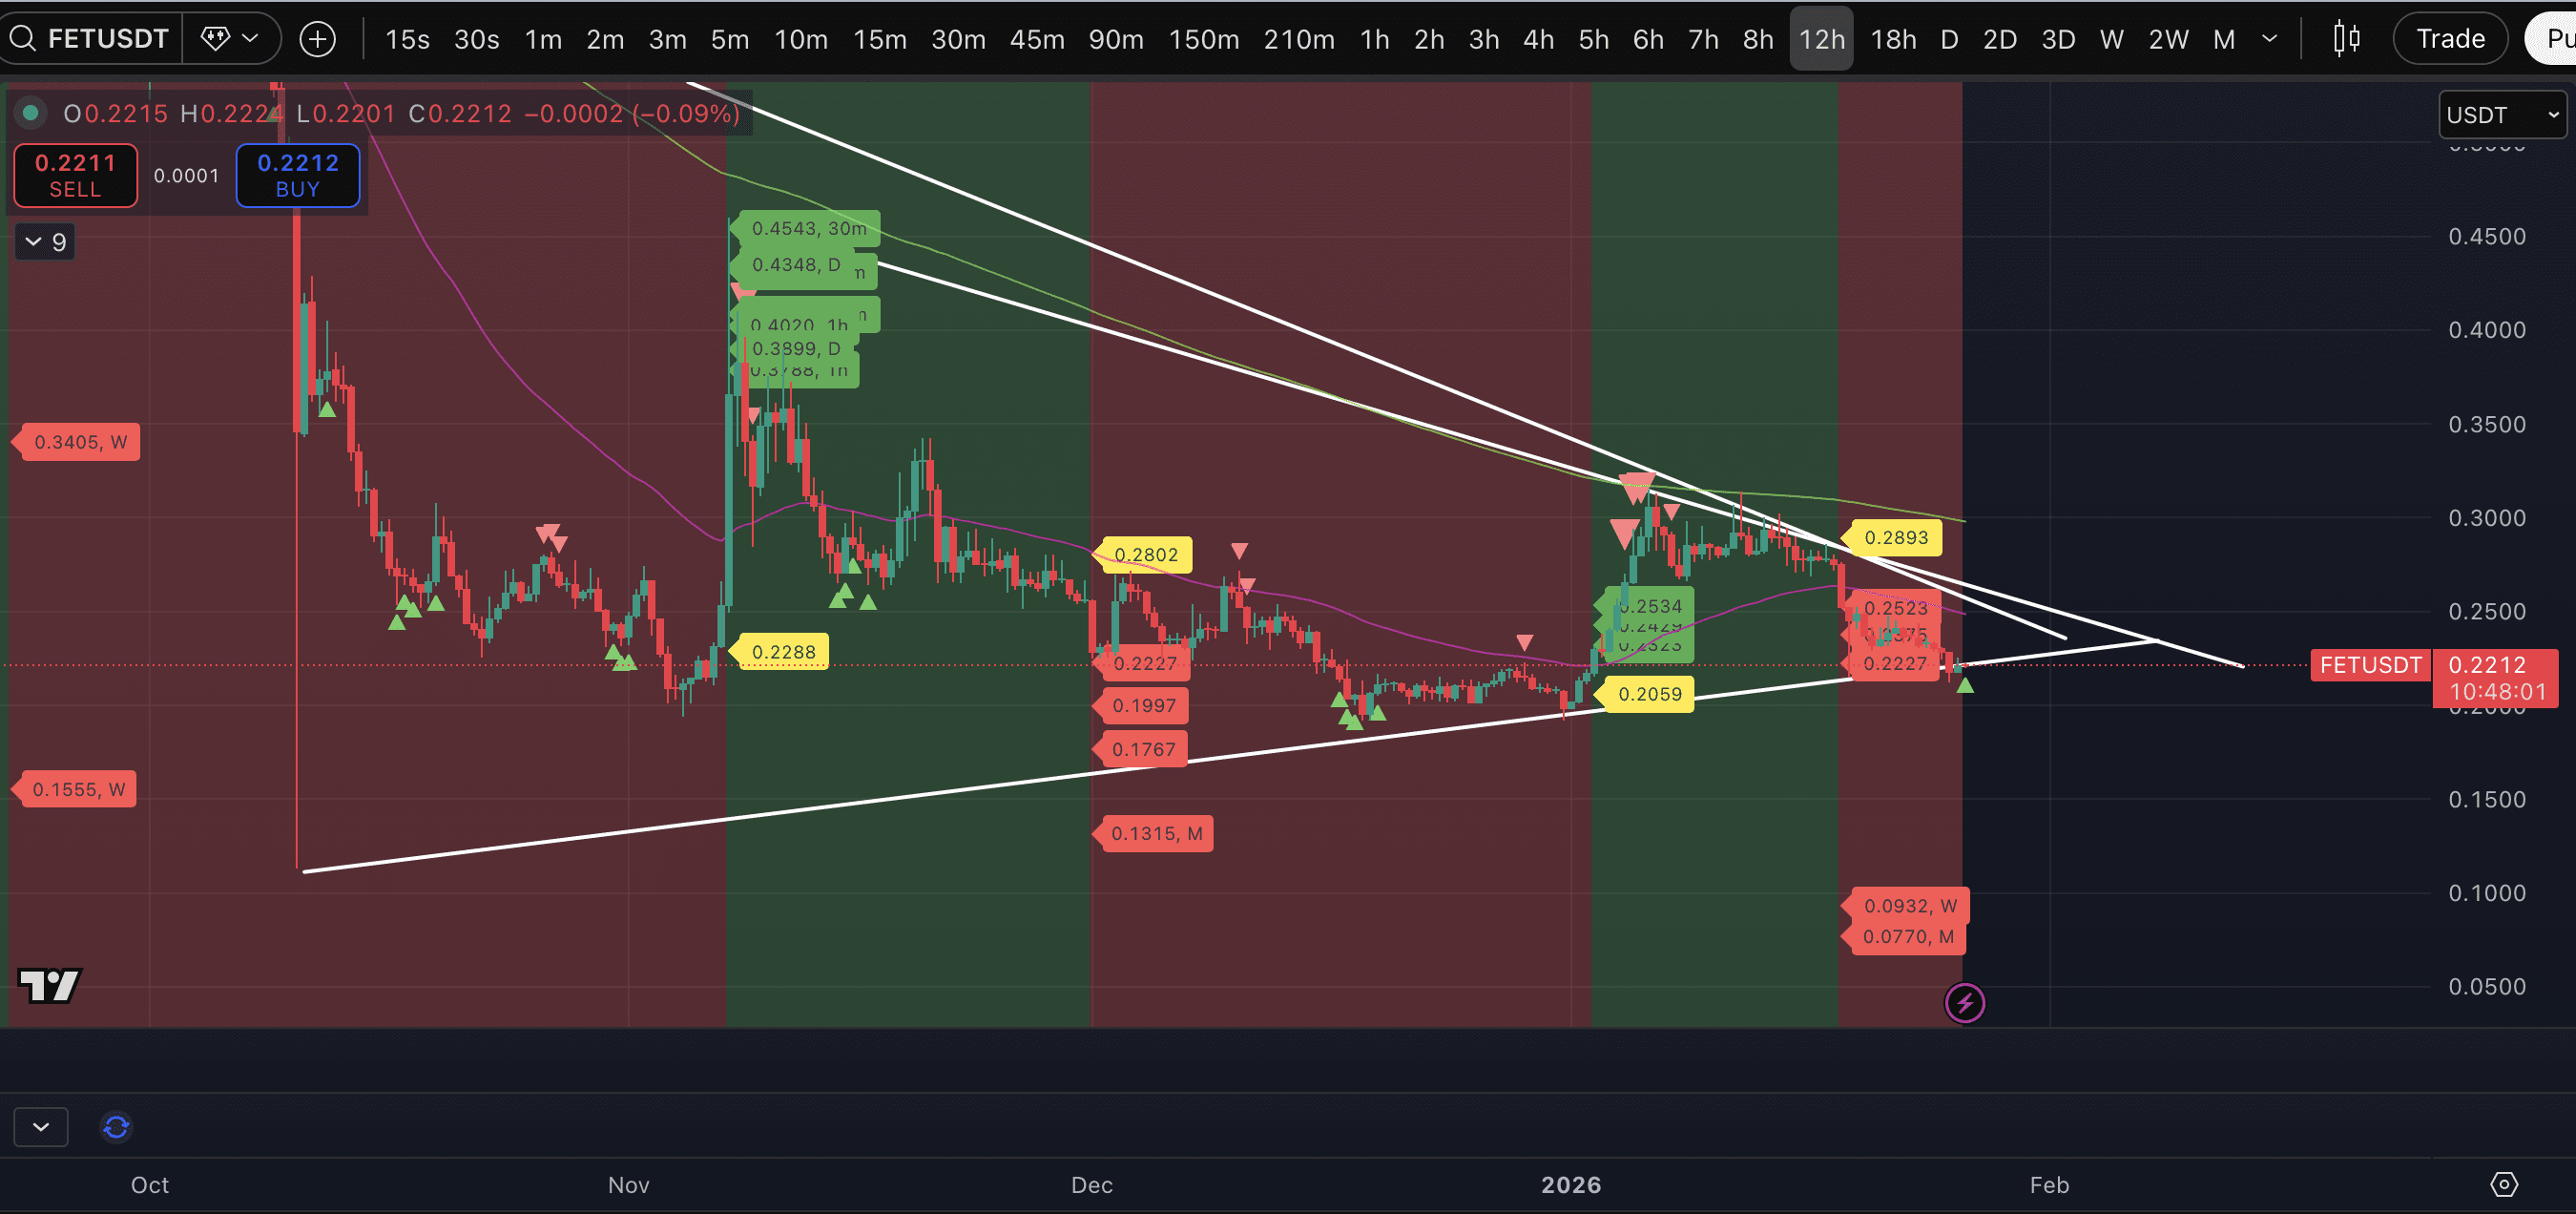
"More broadly, since the end of October, most assets have formed a Bullish Wedge. This shouldn't be ignored, even though the initially vigorous breakout from the pattern in January fizzled out. There are, of course, exceptions, like FET, which has been forming a Triangle since the fall and is now on the verge of breaking below it, with a target somewhere below zero."
So, for now, the expectation is precisely a rebound. It's on track, and potentially a strong one for certain assets. But any rise that doesn't break through the 50 EMA on the 12-hour timeframe as obvious resistance (and for most assets, the 50 EMA on the daily timeframe is somewhere nearby) will, we repeat, only be a rebound.
We already wrote last night that answers to questions about the market's future trend could be forthcoming as early as Monday night into Tuesday. Two-day timeframe candle close:
- we will either hold or not the stable uptrend for BTC on the 2-day TF,
- we will either hold or not the sustainable downtrend of USDT+USDC dominance on the 2-day TF,
- we will either start or not work out the marks of a potential high of BTC dominance on a 2-day TF.
If the trend situation on this timeframe turns bearish, it is highly unlikely that the market will see a bullish picture in the coming days and weeks.


