$DOGE DOGE/USDT Candle Chart Interpretation
📉 Recent Price Action
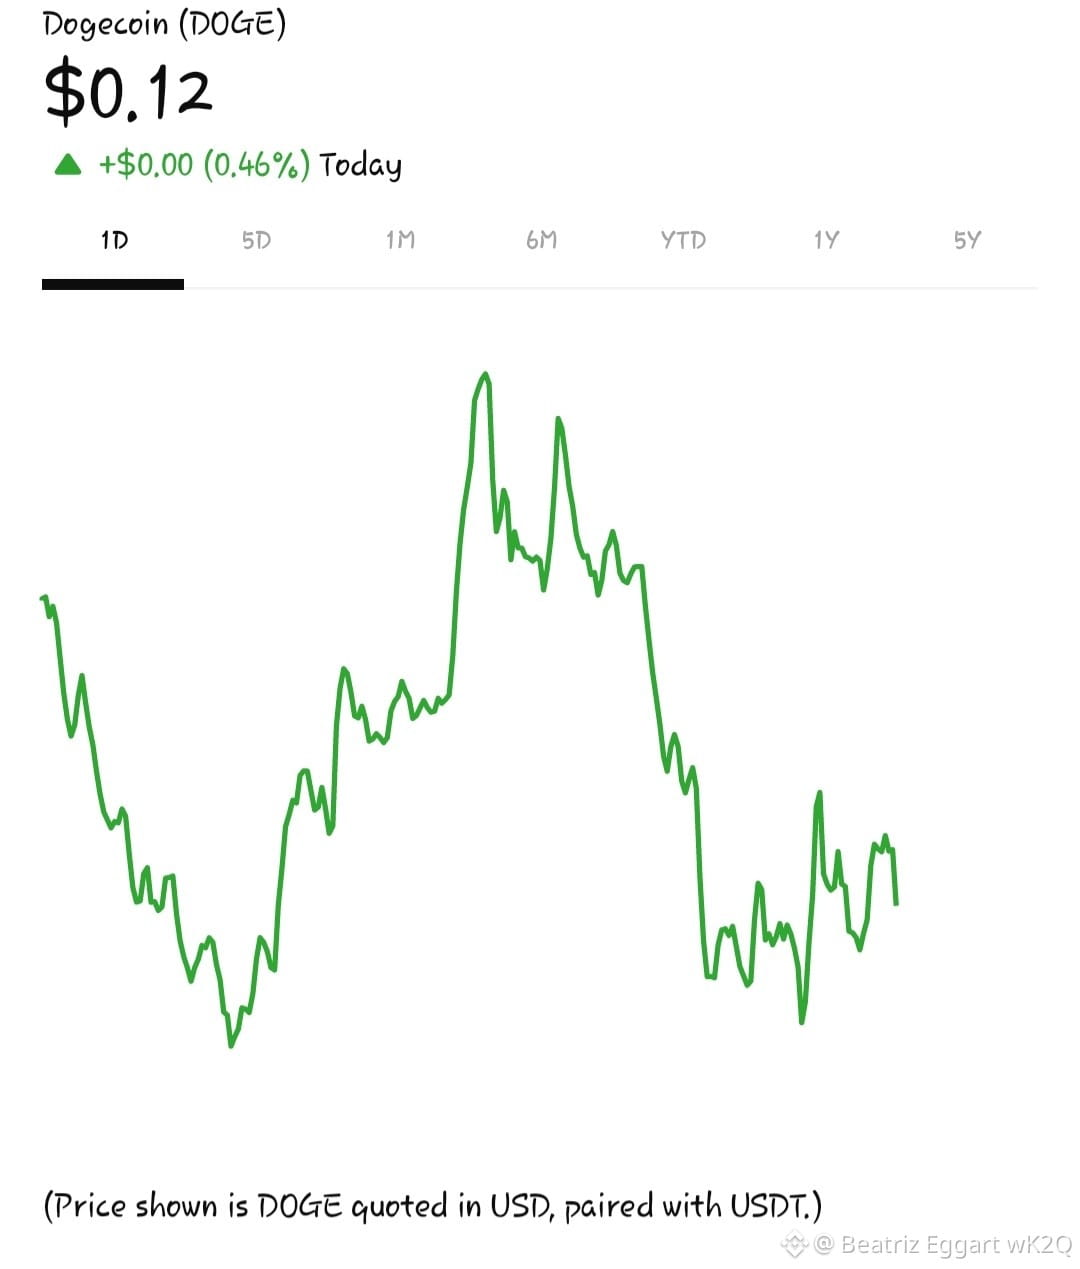
The current DOGE price is around $0.1246, with high and low showing tight intraday price movement so far (0.1271 → 0.1239).
This indicates low volatility right now, often seen before a breakout or deeper trend continuation.
🔎 Short-Term Candlestick Signals
Bullish reversal candles (e.g., bullish engulfing) have shown up near local support levels (~$0.1238), suggesting short-term bounce attempts. �
AInvest
RSI is in overbought territory in some recent sessions after upward moves, implying potential pullback risk before continuation if buyers lose momentum. �
AInvest
📊 Trend and Momentum
On shorter intra-day timeframes, price momentum has been bullish at times but not always sustained.
On the daily setup, broader analysis points to a fragile rebound phase rather than a confirmed trend reversal — price is trying to stabilize but remains vulnerable to pullbacks. �
The Cryptonomist
📌 Key Levels to Watch
Support: The ~$0.12–0.123 range — recent candle lows and psychological support zone.
Resistance: Around recent session highs near ~$0.127 and above that ~$0.13–0.14 — levels where sellers previously stepped in.
📉 Short-Term Outlook
Bullish scenario: If DOGE breaks above the immediate high ($0.127) with strong volume, we may see continuation toward higher resistance ($0.13+).
Bearish scenario: If candles begin closing below major support (~$0.12), sellers could push the price lower, strengthening the bearish trend context.$XRP