Ethereum ($ETH ) 4-Hour Outlook & 2026 Expectation

Here’s a brief market outlook on Ethereum ($ETH ) from a 4-hour candle chart perspective and what many analysts and forecasts are suggesting for 2026. This is for informational purposes only — not financial advice.
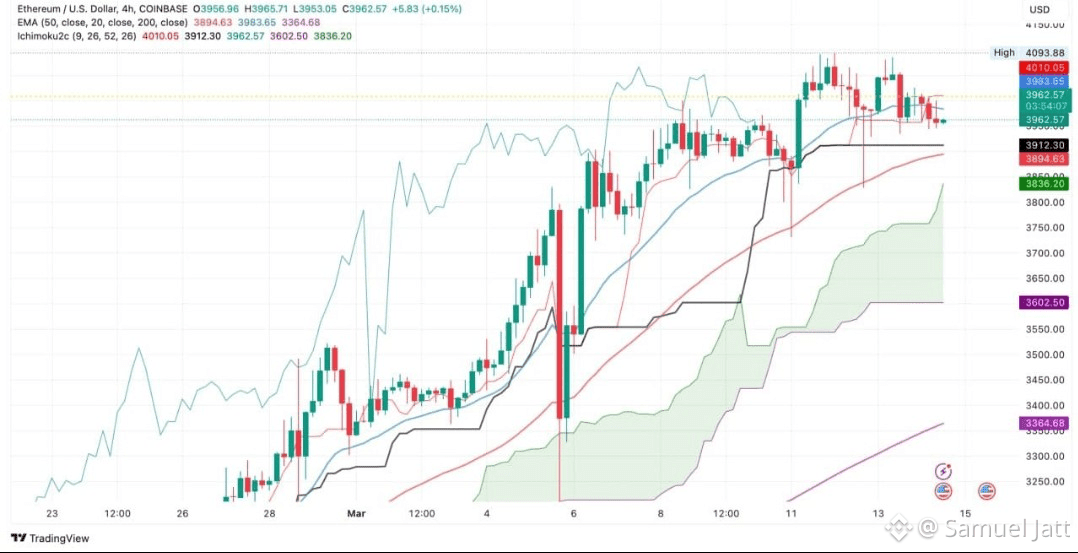
📊 What the 4-Hour (4H) Chart Shows
Trading on the 4H timeframe helps traders spot medium-term trends and key levels of support and resistance:
$ETH often trades in ranges, respecting clear support and resistance zones on the 4H chart. A breakout above resistance could signal momentum continuation, while failure can mean range-bound action or pullbacks. �
Chart patterns like ascending triangles often precede breakouts, and candlestick setups can show trend reversals or continuations.
Short-term movement is typically tied to market structure, EMAs, and RSI direction — bearish momentum on 4H can lead to declines, while bullish signals can drive rallies. �
📅 ETH in 2026 — What Analysts Are Saying
Analysts and price models vary widely, but several common themes emerge for Ethereum’s outlook in 2026:
📈 Bullish / Base Expectation
Many technical forecasts see ETH potentially climbing into mid to high four-figure ranges (e.g., $4,000–$6,400). �
Base-case predictions often assume ETH continues adoption, DeFi growth, and network upgrades, with average prices in the $3,400–$5,000+ band during 2026. �
🚀 Bullish Scenarios
Some forecasts — especially from institutional and macro-oriented sources — project much higher ranges (e.g., $7,000–$9,000, even toward five-figure territory in extended cases) if adoption, ETFs, and tokenization trends accelerate. �
CoinMarketCap
📉 Bearish/Risk Scenarios
Bearish price risks include macro headwinds or failure to break key technical barriers, which could keep prices closer to recent ranges, or lower support zones around the mid-$2,000s. �
⚖️ Key Market Drivers Through 2026
Network adoption: DeFi, NFTs, rollups, and enterprise usage can increase demand for ETH. �
Technical pattern breakouts: 4H and larger timeframe breakouts or breakdowns often guide price structure changes. �
Macro & institutional flows: ETF approvals and institutional capital can swing sentiment. �
CoinMarketCap
Volatility: Cryptocurrencies remain volatile; ranges on 4H charts may persist through news and technical shifts. �
🔎 Remember: Candlestick charts like the 4H are tools — they show historical and current price behavior, not guaranteed future outcomes.
#ETHMarketWatch #MarketRebound #ETHETFsApproved #ETHMarketWatch #USIranMarketImpact