🚀🔥 OG/USDT Technical Eye-Catching Analysis (4H Chart Update) 🔥🚀

Hello Traders! 👁️📈
Today, let’s take a deep dive into the current situation of OG/USDT and break down the price action with a trader’s eye-catching technical analysis. This breakdown will not only sharpen your chart-reading skills but also keep you one step ahead in the market. ⚡💹
---
🕵️ Current Price Action
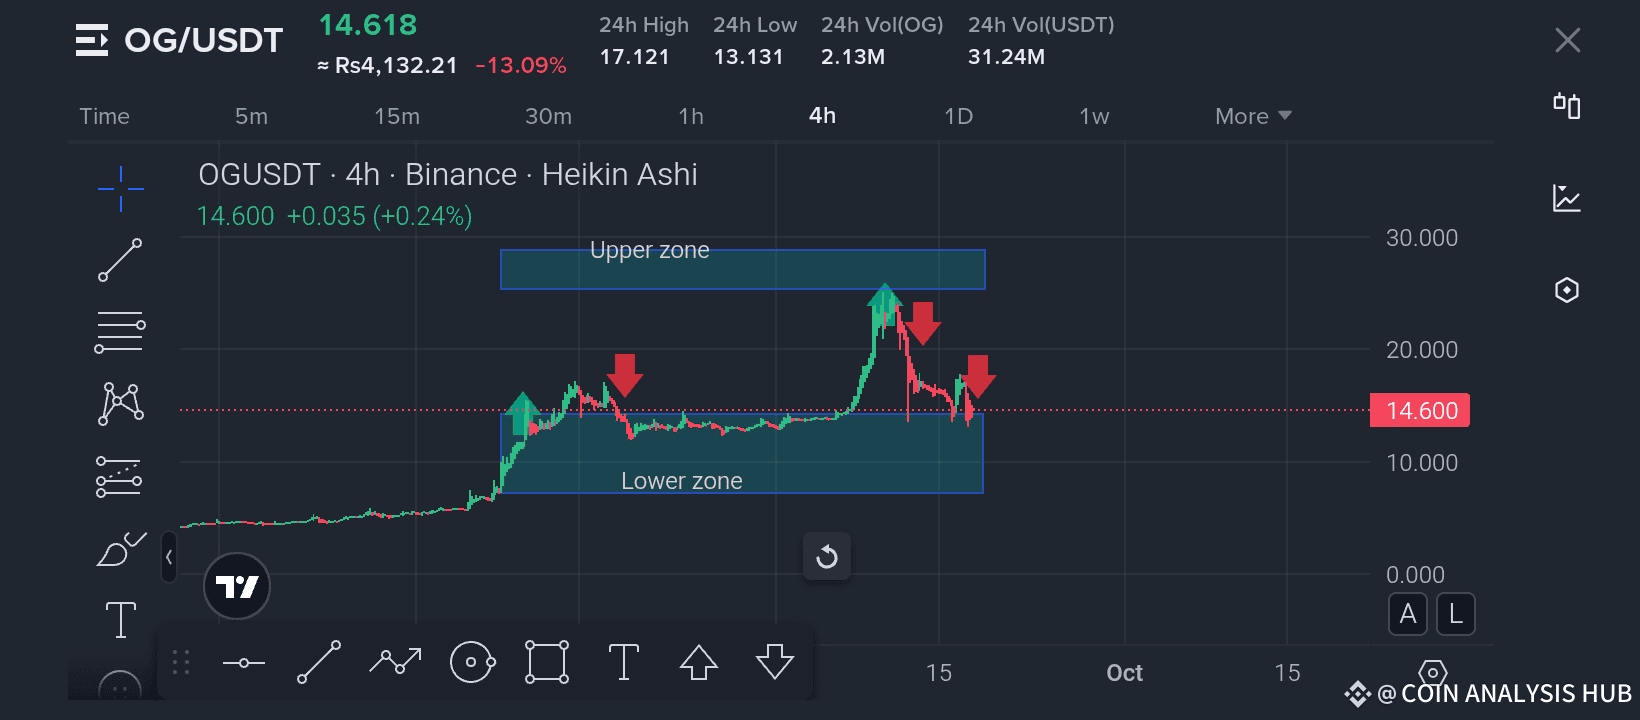
At the moment, OG/USDT is trading around $14.60 after facing a strong rejection from the upper zone 📉. The price has dropped sharply from the $17–$18 range, where we saw multiple rejection candles, highlighted by red arrows in the chart. This confirms that the upper zone is acting as a strong resistance.
On the other hand, the lower zone support lies around $12–13. As long as the price stays above this zone, bulls still have a chance to regain control. If this support breaks, however, we may see a deeper correction toward the $10 level. ⚠️
---
📊 Key Zones to Watch
✅ Upper Zone (Resistance): $18–20 range 🛑
Every time price has tested this region, sellers have taken over. Until the candle closes above this area with volume confirmation, it remains a no-go zone for aggressive longs.
✅ Lower Zone (Support): $12–13 range 🛡️
This is where buyers previously stepped in and pushed the price higher. If we see bullish reversal candles (long wicks, engulfing patterns) in this zone, it could be a golden opportunity for accumulation.
---
📈 Trend Outlook
Short-Term (4H Chart): Bearish pressure is visible after the recent rejection. Sellers are dominating. 🚩
Mid-Term: Consolidation expected between $13–18 range before the next breakout.
Long-Term: If bulls manage to break and sustain above the $20 level, we could witness a sharp rally towards $25–30+ levels. 🚀
---
🔎 Technical Indicators & Observations
1. Heikin Ashi Candles show red dominance after the last bullish spike — confirming selling pressure. 🟥
2. Volume Analysis: High sell volume during rejection zones indicates smart money taking profits at the top.
3. Market Psychology: Traders who bought late at highs are now panic selling, giving opportunities to patient buyers around support zones.
---
🛠️ Trading Strategy (Not Financial Advice)
📌 For Bulls (Buyers):
Wait for price action signals near the $13 support zone.
Ideal entry: Accumulation with tight stop-loss below $12.
Targets: $17 (short-term), $20+ (mid-term).
📌 For Bears (Sellers):
Look for rejection candles near $17–18 zone.
Target zones: $14.5, then $13 support.
Risk management: Always secure profits step by step.
---
⚡ What Traders Should Do Now
👉 Stay patient and don’t chase pumps! 💡
👉 Respect the zones — trade the reaction, not the prediction.
👉 Keep an eye on volume spikes and candlestick formations before entering.
👉 Remember: Market rewards discipline, not emotions.
---
🏆 Final Words
Traders, this is the make-or-break zone for OG/USDT. 📍 The upper zone (resistance) will decide whether the market is ready for another breakout 🚀, or if we are heading back into consolidation and correction 📉.
💎 Be smart, follow your levels, and let the market show its hand. Don’t forget — patience is your biggest weapon in trading! 🕰️⚔️
---
💬 What’s your strategy for OG/USDT? Bullish 📈 or Bearish 📉?
Drop your thoughts in the comments, like 👍, share 🔁, and follow 🔔 for more trader’s eye-catching technical breakdowns. Your support keeps the motivation alive 💵✨.
⚡Stay sharp, trade smart, and let’s ride the waves together! 🌊🚀
Best of luck 🤞 🍀 🤞