Historical patterns are sounding the alarm for $XRP . Crypto analyst Steph Is Crypto has highlighted a recurring trend involving the 50-week Simple Moving Average (SMA) that has preceded every major XRP crash since 2015. 📊
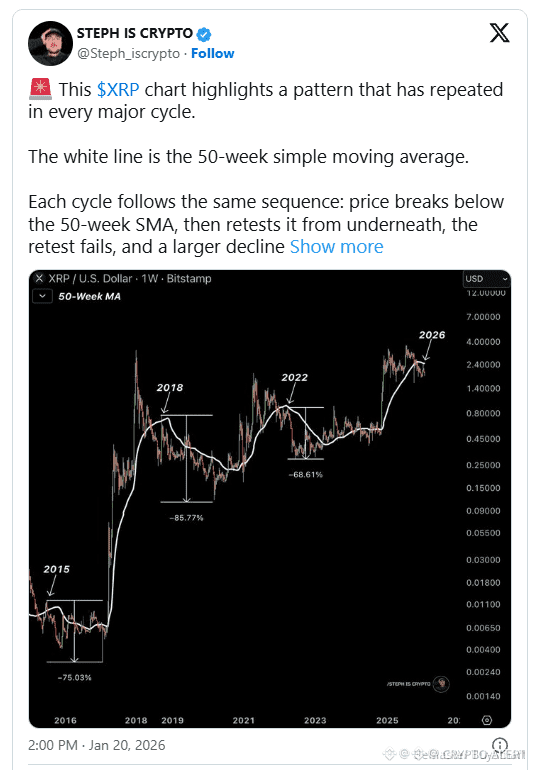
In the world of cycle analysis, the 50-week SMA is the "line in the sand." When price stays below it, the long-term trend turns bearish, and the average flips from support into a heavy ceiling of resistance. 🏛️
 The Ghost of Cycles Past: 👻
History shows that when XRP loses this level, the "floor" tends to drop significantly:
2015: Failed SMA support ➡️ ~75% Drop 📉
2018: Failed SMA support ➡️ ~85% Drop 📉
2022: Failed SMA support ➡️ ~68% Drop 📉
The Current Reality (January 2026): 🔍
XRP is currently battling at a critical juncture near $1.89. After a brief resurgence earlier this month, the price has struggled to reclaim the 50-week SMA. This weekend’s dip from $2.00 to $1.84 mirrors the "retest and fail" behavior seen in previous cycles. 📉
Where Could the Bottom Be? 📉
If the historical pattern of 68%–85% declines repeats from recent local highs:
Bear Target 1: $0.59 (A level not seen since late 2024) 🧱
Bear Target 2: $0.27 (The extreme historical support from 2021) 🚨
The Bottom Line: While past performance isn't a guarantee, the 50-week SMA is a decisive factor. If XRP cannot stage a quick recovery and reclaim this moving average, the "correction" could be much deeper than many expect. ⚠️
Are you holding through the volatility, or is the 50-week SMA signal too loud to ignore? 👇
