Current Market Outlook:
Bitcoin ($BTC ) continues to show impressive strength after reaching a new all-time high near $125,000. Despite minor intraday pullbacks, the broader market structure remains bullish, supported by technical patterns and macro sentiment.
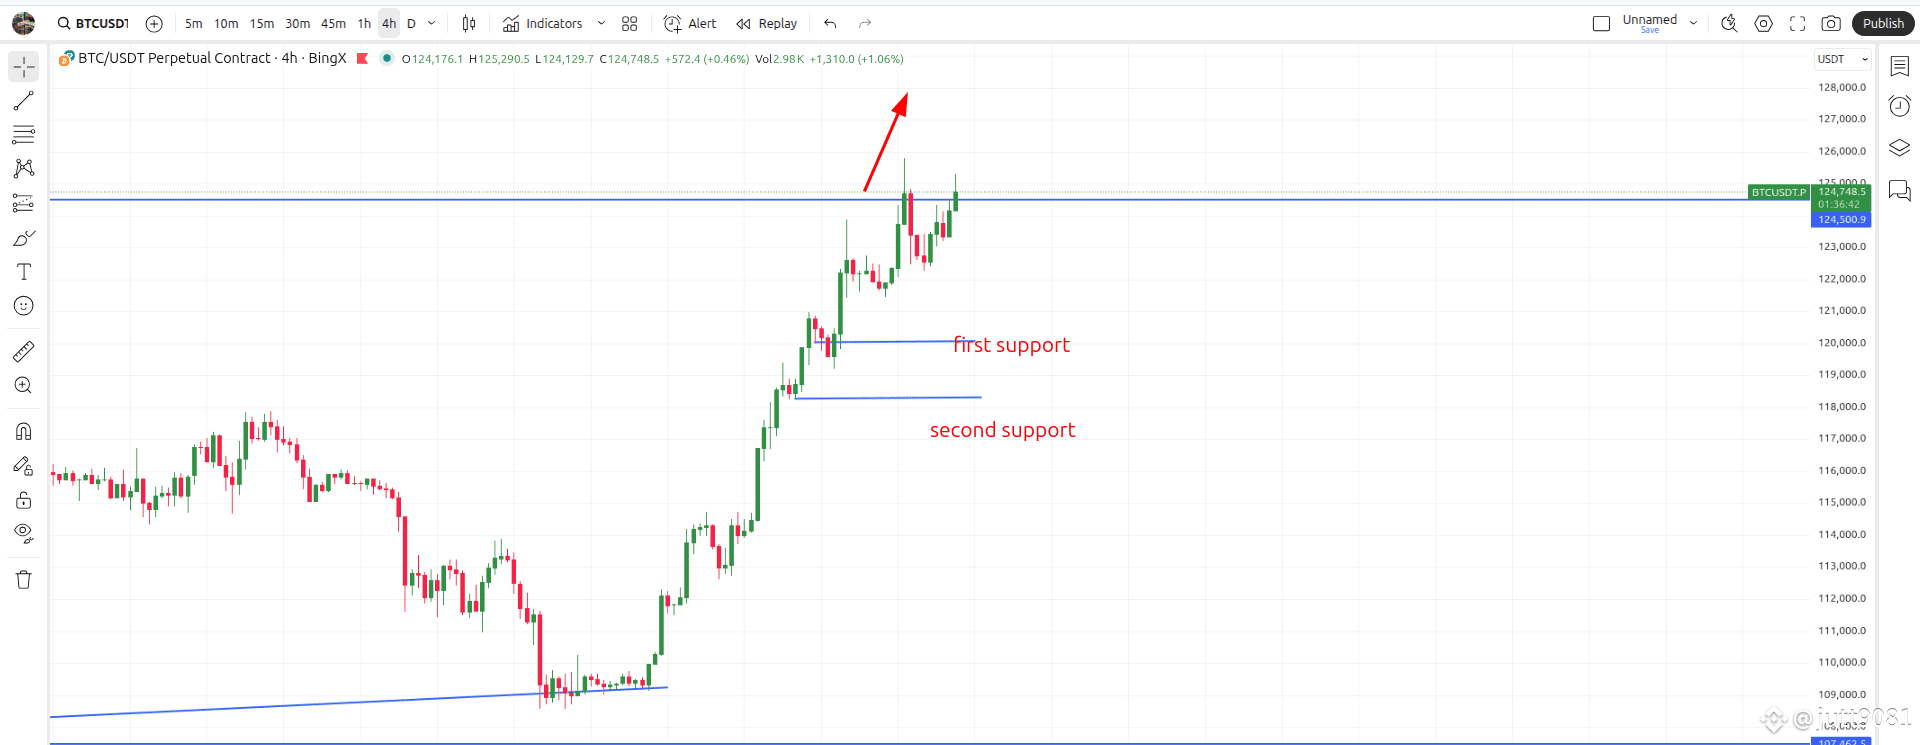
🔍 Technical Snapshot
Immediate Resistance: $127,000
First Support: $120,193
Second Support: $118,391
Price action on the 4-hour chart suggests Bitcoin is consolidating above key support levels, building a potential base for another upward leg.
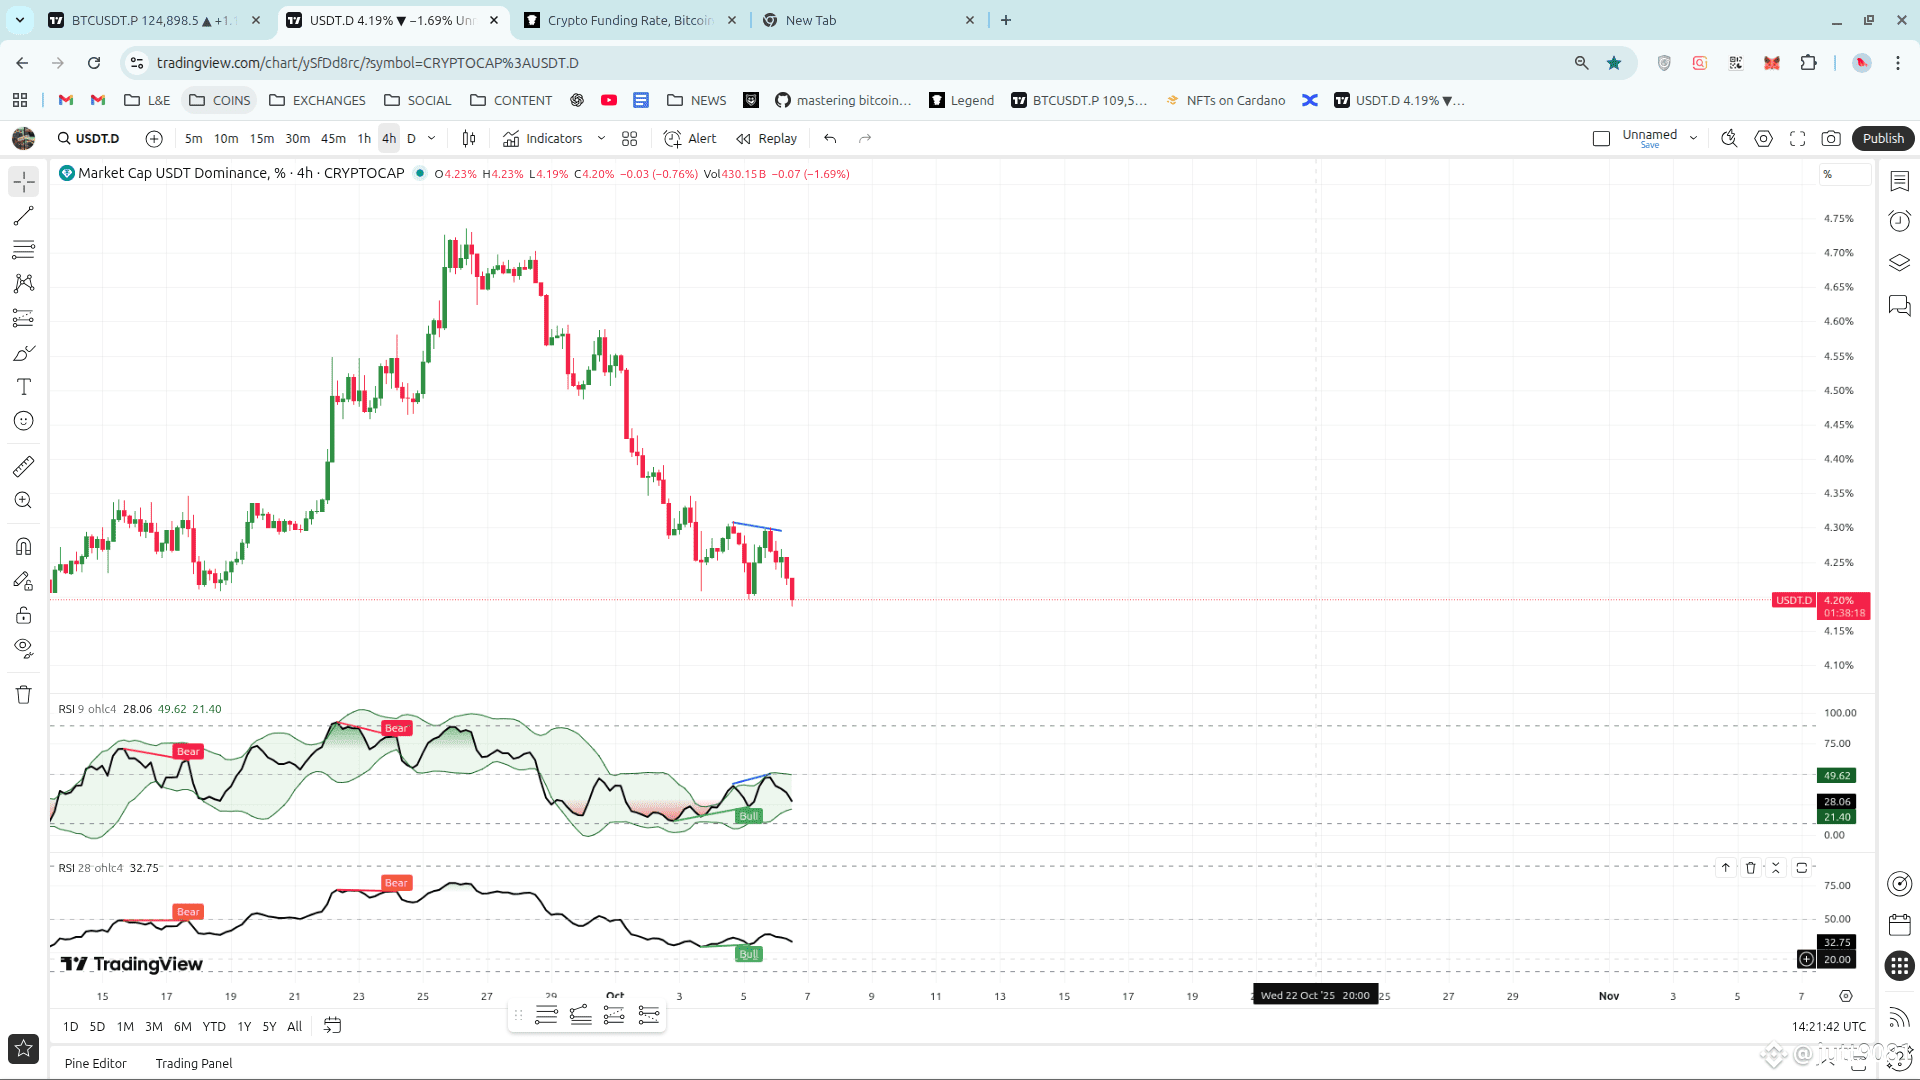
💹 USDT Dominance Insight
USDT Dominance (USDT.D) has formed a hidden bearish pattern on the 4-hour chart — a signal that often precedes capital rotation from stablecoins into crypto assets.
Historically, this indicates that traders are deploying USDT back into Bitcoin and altcoins, which tends to fuel short-term bullish momentum.
📈 Market Implication
If BTC holds above the $120K zone, a push toward $127K remains the most probable short-term move.
Momentum indicators like RSI are cooling down while price holds firm — a sign of strength amid consolidation.
However, a clean break below $118K could trigger a temporary correction before renewed upside.
⚠️ Conclusion
Overall sentiment stays constructively bullish.
Traders may look for buy setups near support zones while managing risk carefully.
The hidden bearish signal in USDT.D reinforces the view that Bitcoin’s upward momentum is not yet exhausted.
