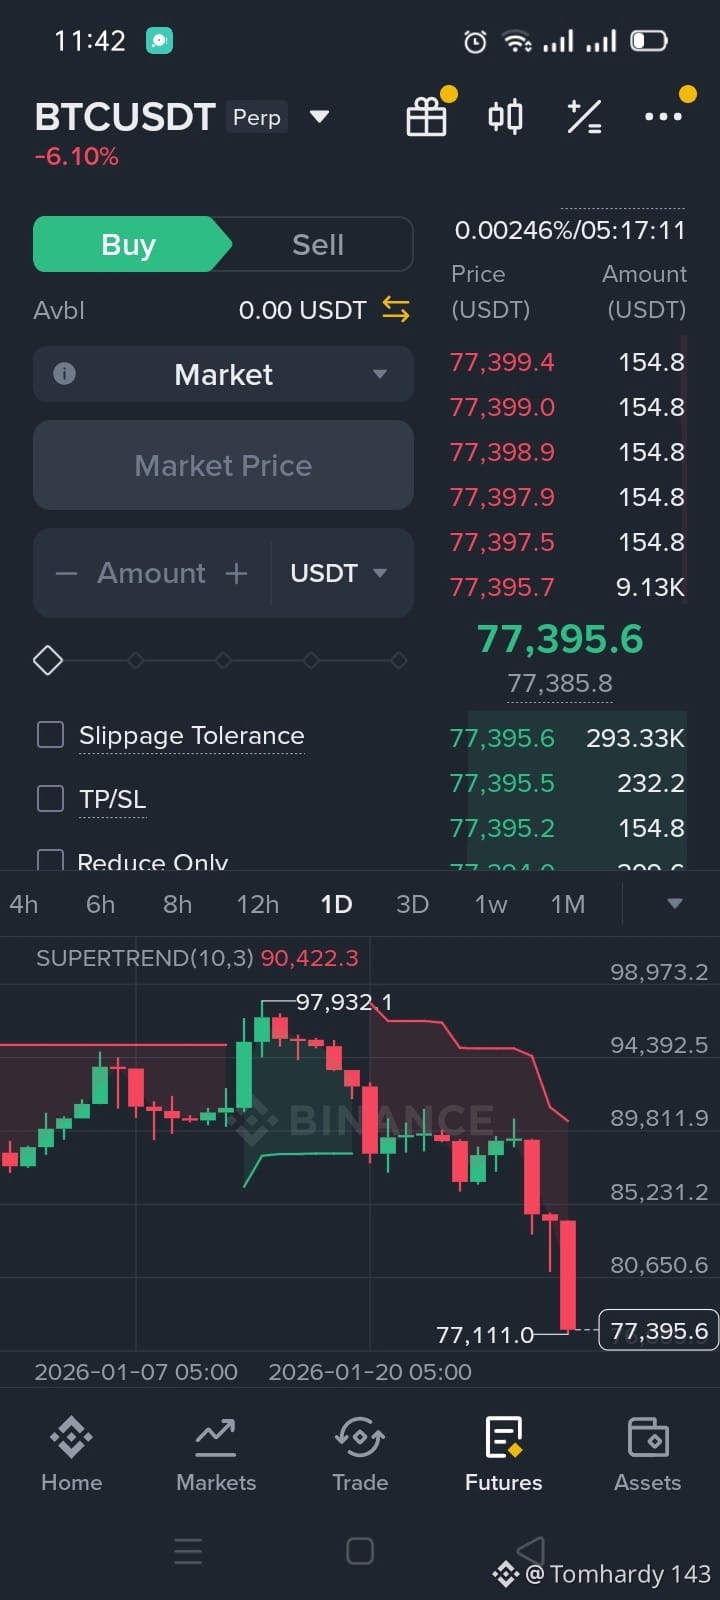
$BTC Bitcoin (BTCUSDT Perpetual) is under strong selling pressure. In the picture, the price has dropped about 6% and is trading near 77,000 USDT. The daily (1D) chart shows big red candles, which means sellers are controlling the market.
The Supertrend indicator is red, and price is trading below it. This usually shows a bearish trend. After making a high near 97,900, Bitcoin failed to hold and started a strong fall. Recent candles show weak buying and no clear reversal yet.
Overall, the market sentiment looks negative, and traders are cautious.
Will BTC go up or continue short? (Simple View)
Short-term:
BTC looks bearish. Chances are higher that price may move sideways or go a bit lower before any strong recovery.
Support area:
Around 75,000 – 76,500 USDT (if this breaks, more downside is possible).
Resistance area:
Around 80,000 – 82,000 USDT (price needs to break above this to turn bullish).
Trend decision:
Below resistance → Short / Bearish bias
Strong daily close above resistance → Bounce possible
Conclusion (Easy words)
Right now, BTC trend is down. Until a clear reversal or strong green candles appear, the market favors short trades rather than long. Always use stop-loss and manage risk.
⚠️ This is market analysis, not financial advice. Crypto markets are risky.