As of January 19, 2026, Solana $SOL is showing a dynamic "recovery-under-fire" pattern. Following a volatile start to the year, the asset is currently navigating a pivotal breakout phase.
SOL Technical Analysis & Candle Patterns
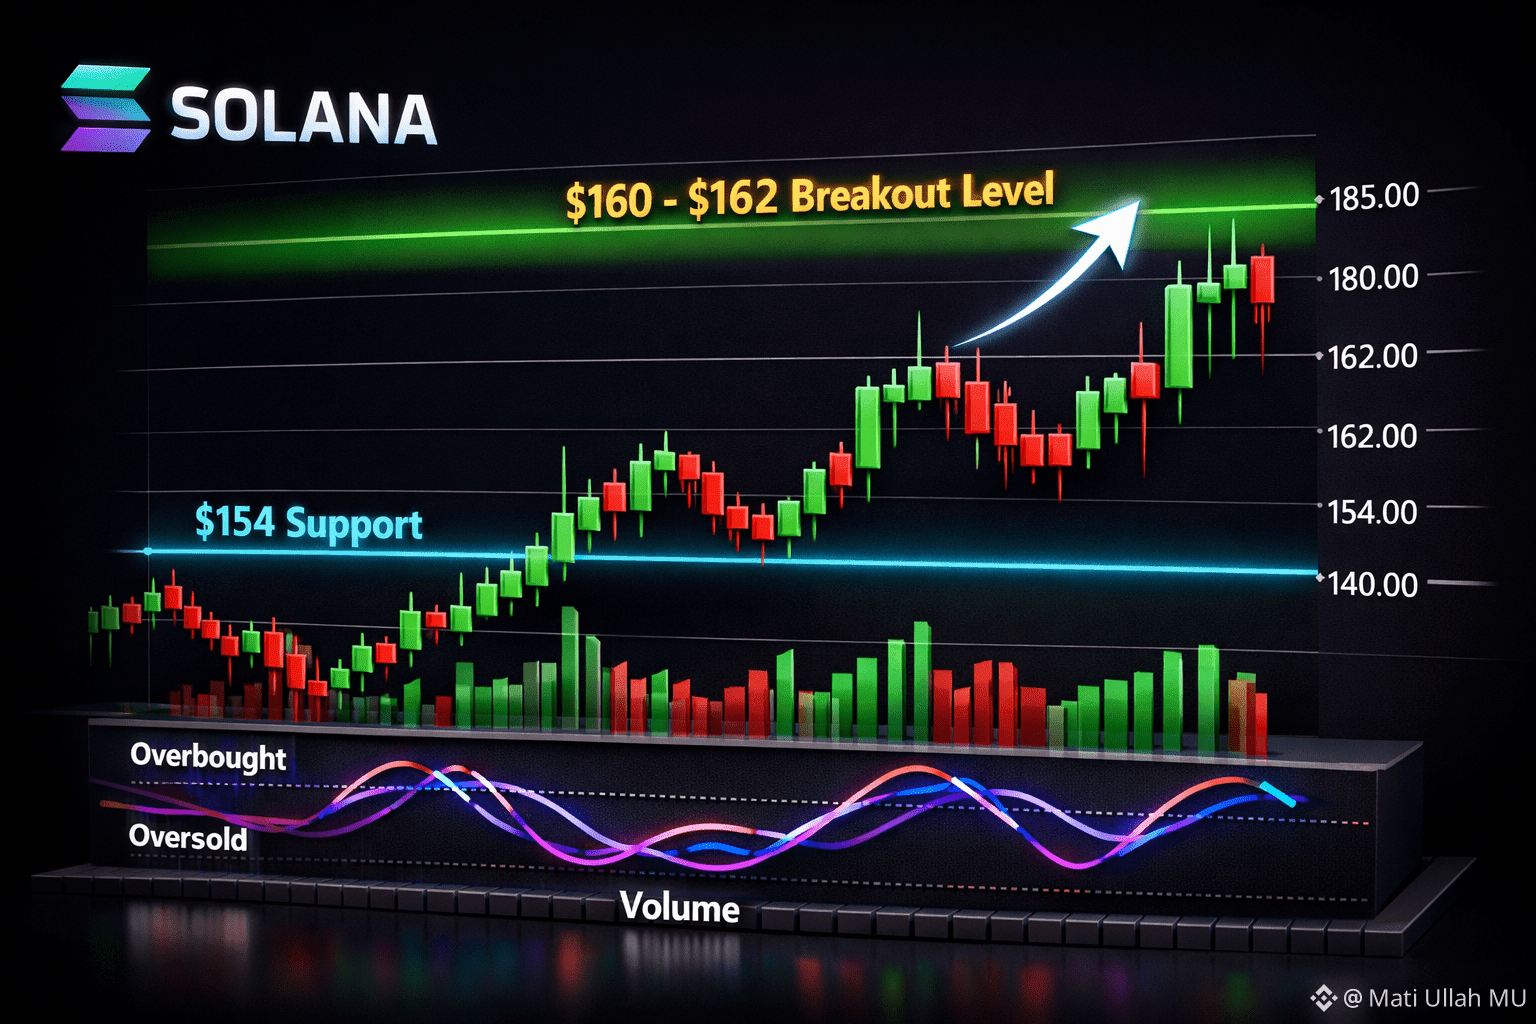
The recent candle chart for SOL reveals a transition from a defensive posture to a cautiously bullish one:
* The "Bullish Breakout" (Jan 15–17): After spending much of early January consolidating near $120, SOL formed a series of strong Green Marubozu and Bullish Engulfing candles. This allowed it to breach the critical resistance at $145, which had previously acted as a ceiling.
* Current Price Action: SOL is currently trading around $142–$145. On the 4-hour chart, we are seeing a Doji and Inverted Hammer formation, suggesting that buyers are pausing to catch their breath after the 16% year-to-date rally.
* Support & Resistance:
* Immediate Support: $137.65 (former resistance, now being tested as a floor).
* Major Resistance: $152.20. Breaking this level would likely confirm a shift toward a long-term bullish trend.
Market Sentiment & Fundamentals
| Metric | Status | Analysis |
|---|---|---|
| RSI (14-Day) | ~52 (Neutral) | Indicates room for more upside before reaching "overbought" territory. |
| Trend | Ascending Channel | SOL is respecting a rising support line, forming higher lows since late December. |
| Network Utility | High | The launch of "Forex Perpetuals" on Solana (Jan 15) has increased on-chain volume, providing fundamental support for the price. |
Summary Outlook
The "emotional heartbeat" of the chart suggests cautious optimism. While short-sellers were heavily liquidated during the mid-month spike, the current "calm phase" indicates the market is looking for a secondary catalyst—likely macro-economic data like the upcoming Fed PCE report—to decide if the next move is a push toward $160 or a retest of the $125 support.
Would you like me to generate a specific 24-hour price prediction based on these techn
ical indicators?