🚀 $BTC – Complete Macro Trading Blueprint (Updated With SuperTrend Logic)
🟩 1. Long Entry Zone (EMA Ribbon Support)
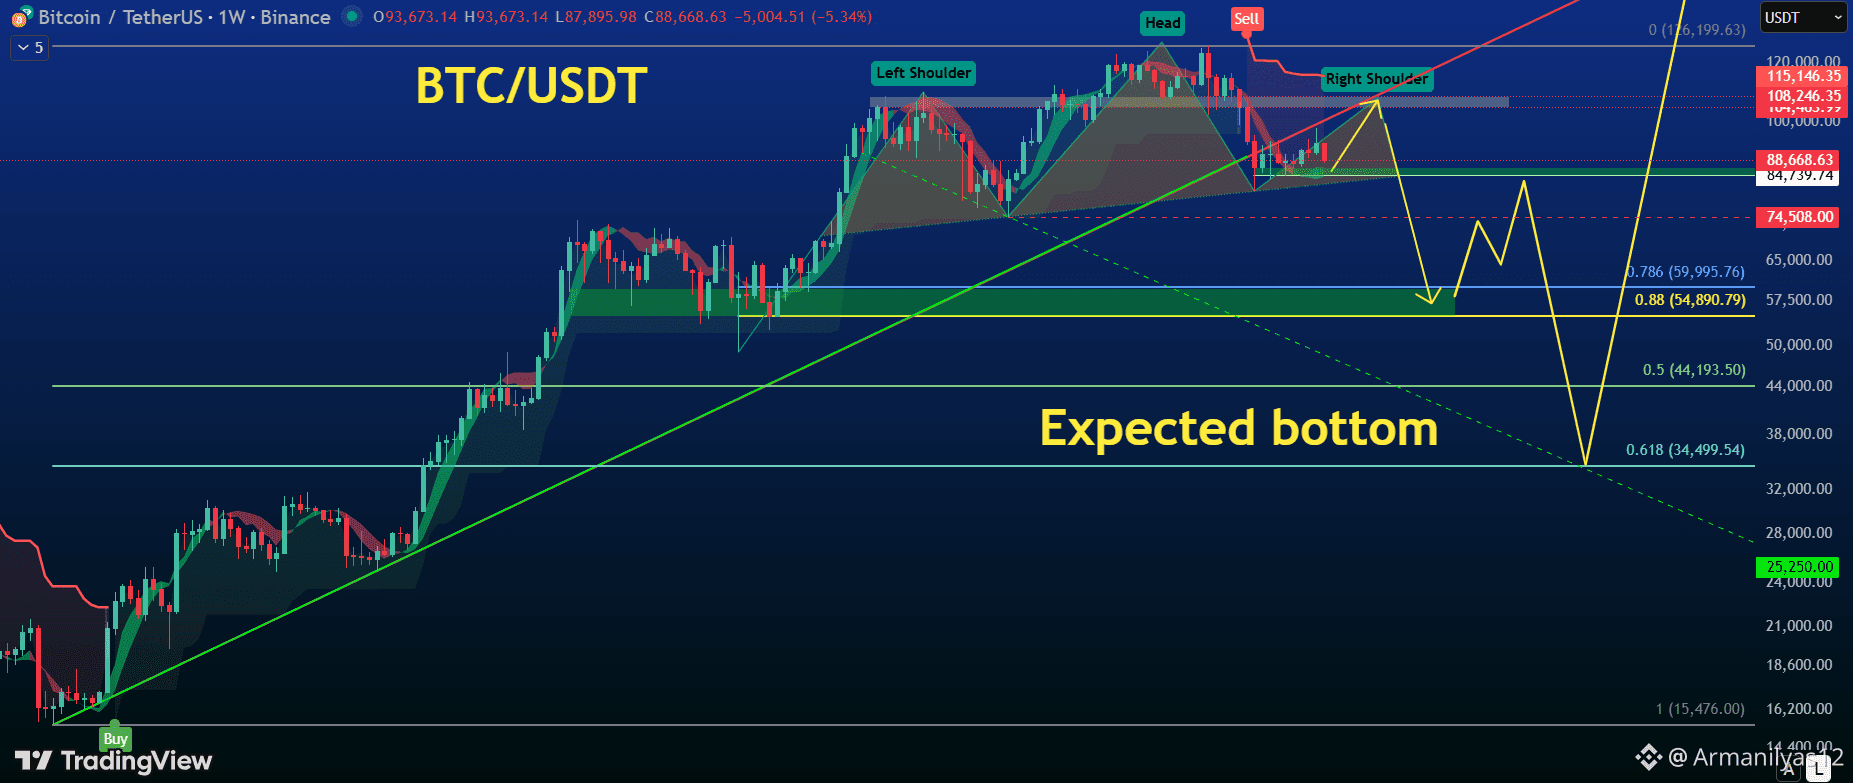
$84,739 – $86,830
#BTC is holding inside the weekly EMA Ribbon, which is currently green and expanding.
This entire ribbon width acts as a strong dynamic support, making it the ideal zone for long entries toward the Right Shoulder.
🟦 2. Right Shoulder Target Zone (Dual Resistance Zone)
$104,463 – $108,246
BTC is expected to rally into the Right Shoulder where two major resistances meet:
🔹 Horizontal Weekly Resistance
Strong supply where previous rejections happened.
🔹 Nov-2022 Trendline Resistance
A macro trendline from Nov-22 acting as upper structure resistance.
📌 This creates a high-probability reversal zone, ideal for taking profit on longs and preparing for shorts.
🔻 3. Updated Weekly SuperTrend Logic (Very Important)
BTC triggered the Weekly SuperTrend Sell Signal when price dropped to $93,000.
At that moment, the SuperTrend line was positioned around $115,000, and it is still standing there now.
📌 Historical SuperTrend Behavior:
Whenever the SuperTrend gives a Sell Signal, the following sequence always happens:
1️⃣ Market forms a swing low after the signal.
✔ Current swing low: $80.6k
2️⃣ After forming the swing low, BTC moves upward toward the SuperTrend line, typically reaching Fib 0.5–0.618 of the entire move.
➡ This matches perfectly with the target zone: $104k–$108k
3️⃣ Only after this Fib 0.5–0.618 retracement does the real sell-off begin.
✅ What does that mean for the current chart?
SuperTrend Sell was activated at 93k
Swing low was made at 80.6k
Now BTC is showing bullish momentum,
SuperTrend line remains at $115k
➡ So BTC must retrace to Fib 0.5–0.618 ($104k–$108k) before the real downside begins.
This aligns perfectly with the Right Shoulder formation.
🔻 4. Short Setup – Head & Shoulders Completion
After hitting the Right Shoulder zone:
Fib 0.786 → ~$59,995
Fib 0.88 → ~$54,890
This is where the Head & Shoulders pattern completes.
🟩 5. Relief Rally (Before Final Downside)
Expected bullish bounce targets:
$74,500
$80,000 – $84,000
This is the pre-final-correction relief move.
🔻 6. Final Bottom Before Halving
BTC is expected to reach the major cycle bottom in:
Fib 0.5–0.618 → $34,500 – $44,193
This zone aligns with:
✔ BTC macro cycle behavior
✔ SuperTrend retracement history
✔ EMA + trendline confluence
✔ Final accumulation before halving
📌 Final Summary (Fully Updated With SuperTrend Logic)
✔ Long: $84.7k–$86.8k (EMA Ribbon Support)
✔ Target: $104k–$108k (Fib 0.5–0.618 + Dual Resistance + SuperTrend retrace zone)
✔ SuperTrend Sell: Activated at 93k, target 115k → BTC historically retraces to Fib 0.5–0.618 before the real sell
✔ Short: $104k–$108k → down to $60k–$55k
✔ H&S Completion: Fib 0.786–0.88 zone
✔ Relief Rally: $74.5k & $80–84k
✔ Final Bottom: $34.5k–$44.1k
✔ Real bull cycle begins AFTER this retracement
#DYOR #NFA #BTC100kNext? #btc70k