$ADA The annual chart itself speaks volumes.
After a meteoric rise in 2021 to an all-time high at 3.1010, ADA attempted to continue higher, but every following year failed to sustain that momentum. In 2024, price briefly tested the 2022 opening level at 1.3080, but no structural reversal followed.
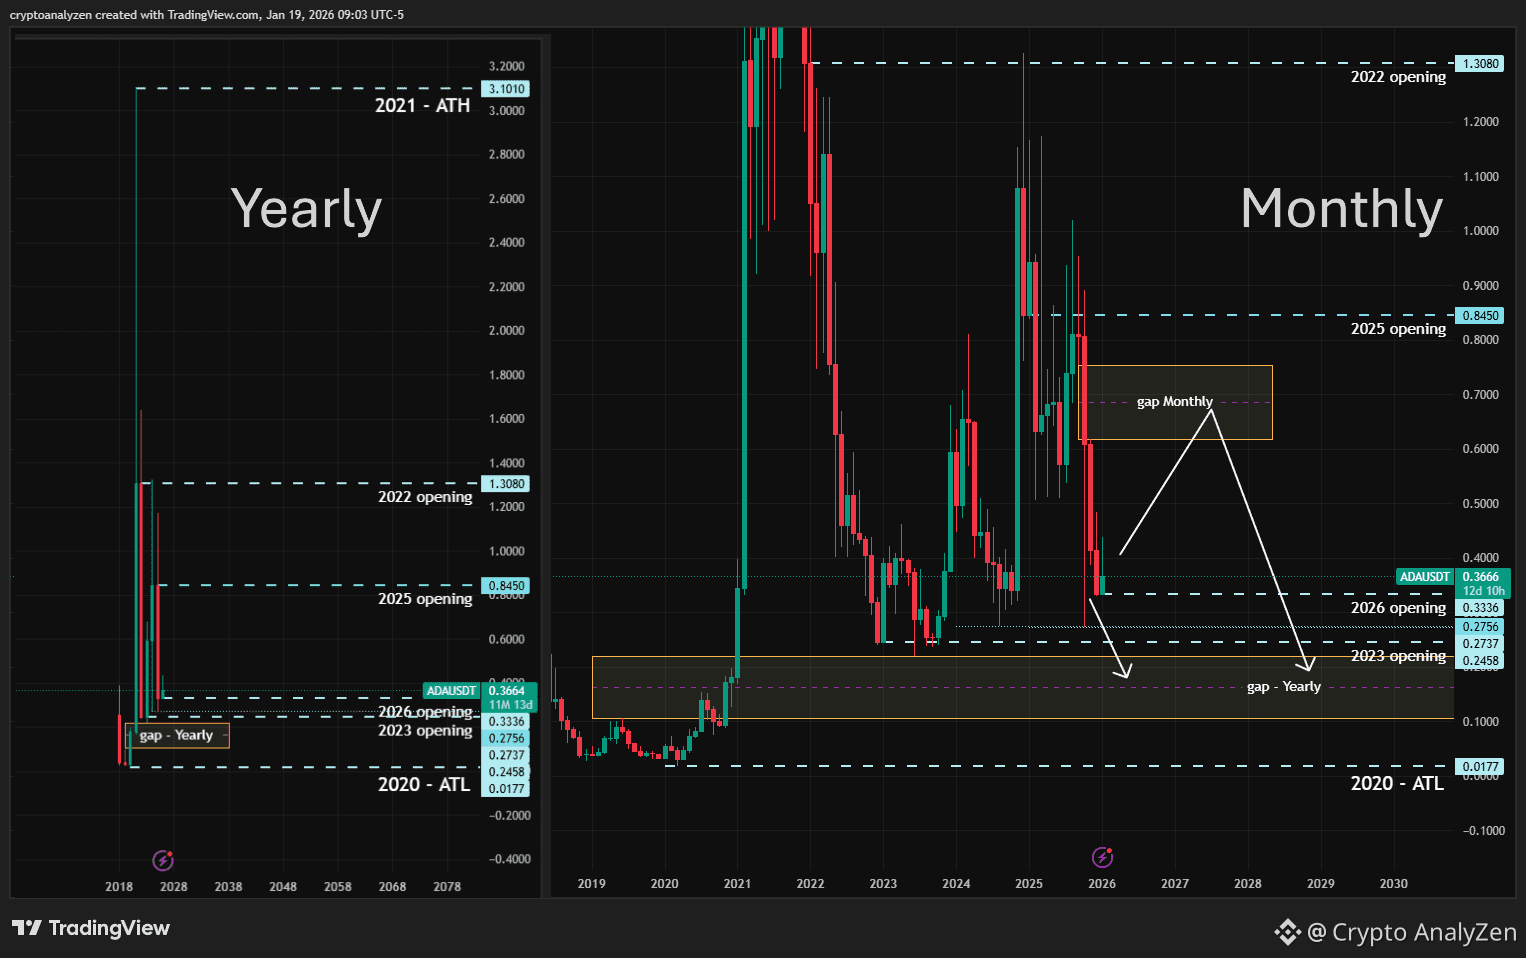
In 2025, a new low was formed below the 2024 low. The annual candle closed with a large red body, which statistically does not favor a bullish continuation.
➡️ High-probability downside test levels:
• 2024 low — 0.2756
• 2025 low — 0.2737
• 2023 opening level — 0.2458
• Annual gap zone: 0.2200 – 0.1069 (2023 low → 2019 high)
On the monthly chart, we can clearly observe the formation of an expanding triangle. In my view, the base of this structure aligns with the 2023 opening level, which was tested multiple times throughout 2023.
We could draw alternative bases for the triangle, but that would be speculative — and I prefer to work only with confirmed levels.
At the moment, price is trading inside the 2024 accumulation zone, which previously ended with a strong upside impulse.
However, the overall triangle structure has already played out its bullish phase:
• Three upward impulses have formed
• The 2025 decline can be classified as a corrective wave
Most likely scenarios from here:
1️⃣ Bearish continuation
Breakdown below the triangle base → full fill of the annual gap
📉 Target zone: 0.22 → 0.1069
2️⃣ Relief upside move
Price pushes higher to fill the monthly gap formed between:
• September 2025 low — 0.7542
• November 2025 high — 0.6189
Both scenarios remain technically valid — but the annual structure currently favors downside pressure over long-term upside expansion.
