In crypto markets, the biggest moves often begin in silence.
$XRP appears to be standing at exactly that moment.
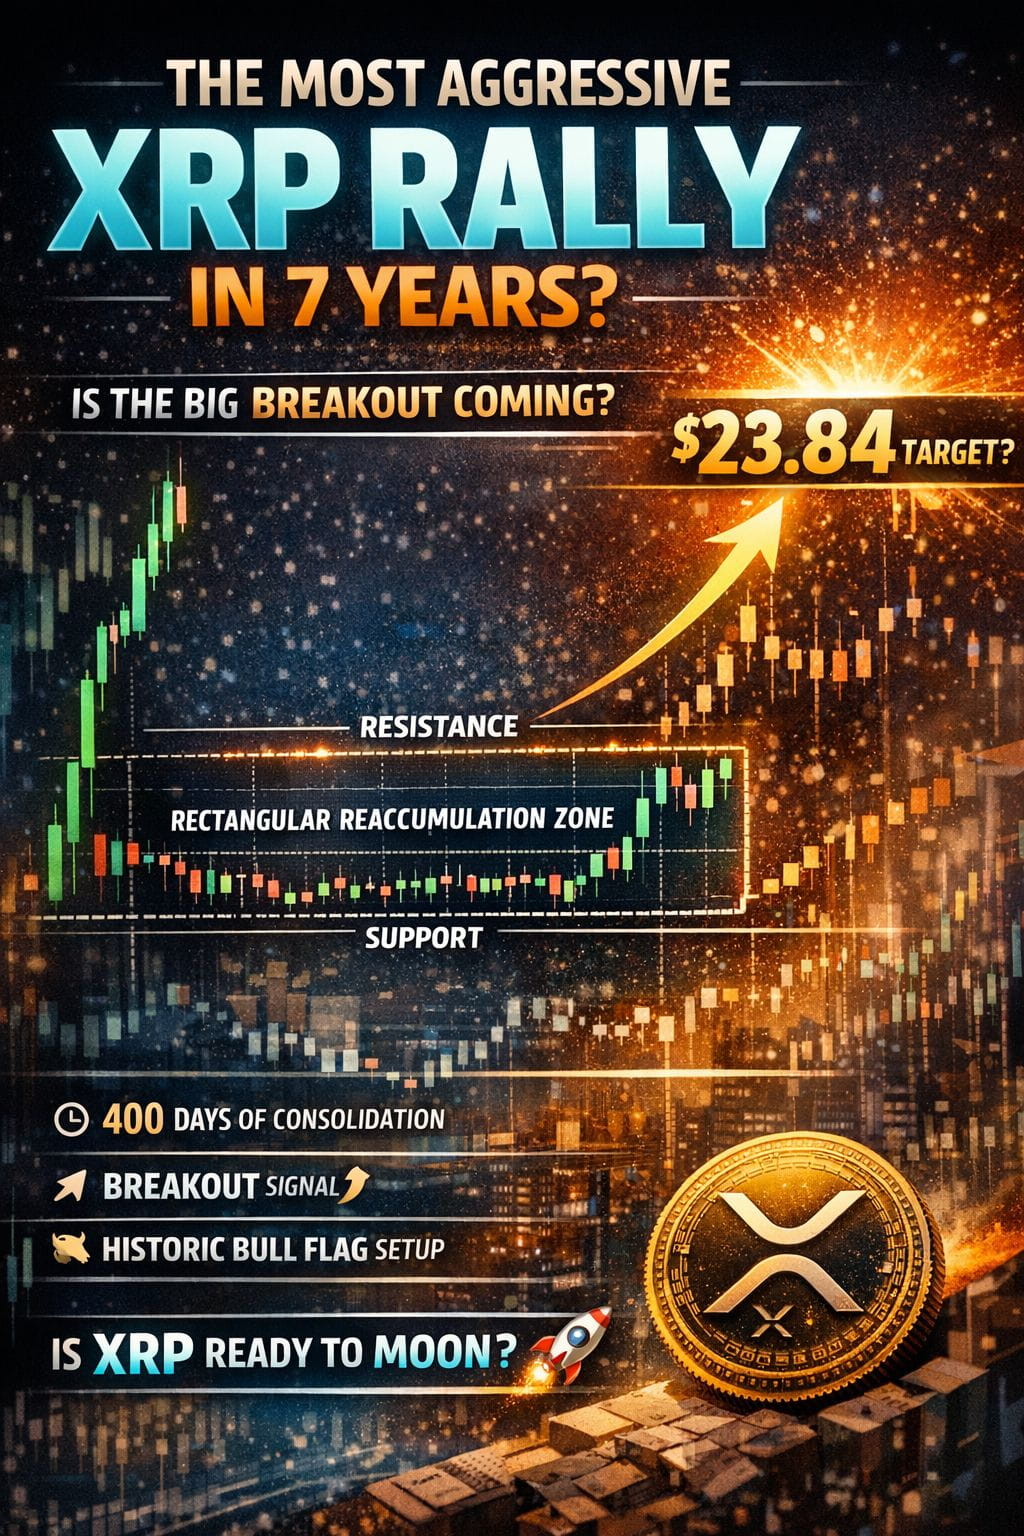
For more than 400 days, XRP has been trading inside a clearly defined Rectangular Reaccumulation Zone—a structure that, in technical analysis, frequently precedes powerful breakout moves.
At this stage, the market is no longer driven by hype, but by structure, patience, and positioning.
According to well-known technical analyst ChartNerd (@ChartNerdTA), this extended consolidation phase could be setting the stage for XRP’s most aggressive rally in nearly 7–8 years, with a potential move into double-digit price territory.
📐 Rectangular Reaccumulation: Silent Positioning by Smart Money
What’s forming on the chart is not ordinary sideways movement.
It is a classic Rectangular Bull Flag.
The structure is clear:
An initial strong flagpole move
Followed by a long period of price compression within a defined support–resistance box
Most importantly 👉 price continues to hold above the reaccumulation support
This behavior is typically seen when: ✔️ Smart money builds positions quietly
✔️ Volatility contracts
✔️ Weak hands exit the market
ChartNerd emphasizes that as long as this support holds, the bullish thesis remains completely intact.
🎯 Breakout Scenario: How High Could XRP Go?
From a technical standpoint, rectangular bull flags follow a simple but powerful rule:
Flagpole height projected from the top of the consolidation range
Using this measurement, XRP’s potential breakout target comes in near:
🔥 $23.84
This is not a random projection.
It is structure-based, technically derived, and historically consistent with previous bull flag expansions.
📌 Key confirmation signals:
A decisive breakout above range resistance
Strong volume expansion accompanying the move
📊 400 Days of Range Trading: Strength, Not Weakness
Many investors mistake long consolidations for weakness.
Experienced traders know better:
The longer the base, the stronger the breakout.
This 400-day range has allowed XRP to:
Absorb previous gains
Establish a strong demand floor
Create clear technical reference levels
Market behavior within this range has been controlled and disciplined, a hallmark of accumulation rather than distribution.
🧠 Historical Context: $XRP Has Done This Before
XRP’s price history reveals a repeating pattern:
👉 Long periods of consolidation followed by explosive moves.
2013–2016: Extended accumulation
2017: Massive breakout
Subsequent cycles show similar behavior
The current structure closely mirrors XRP’s historical bull flag playbook, making this setup difficult to ignore.
🔍 What Investors Should Watch Closely
At the moment, XRP is not driven by short-term hype or viral headlines.
Instead, it sits within a high-probability, high-impact technical setup.
📌 Critical levels to monitor:
Reaccumulation support holding firm
A clean breakout above range highs
Volume confirmation
If these align, XRP could be preparing to write one of the most significant chapters in its market history.
🧩 Final Thoughts
$XRP may appear quiet—but the chart is not.
The chart is prepared.
Markets always leave signals before major moves.
This 400-day structure may be one of those signals that, in hindsight, looks obvious.
“Everything was visible on the chart all along.”
📈 Smart money is watching. The real question is—are you?