Technical Analysis, or TA, is a way traders study the market by looking at price charts and trading volume to understand where the market might go next.
Instead of asking “Is this project good?”, TA asks “How is price behaving right now?”
Simply put: price tells a story, and TA helps us read it.
Key Takeaways (In Simple Terms)
Technical analysis focuses on price history and volume, not news or fundamentals.
Traders use tools like support & resistance, moving averages, RSI, MACD, and Bollinger Bands.
TA helps spot trends, entries, and exits, but it’s not perfect.
False signals happen — especially in low volume or lower timeframes.
Risk management and confirmation are what separate traders from gamblers.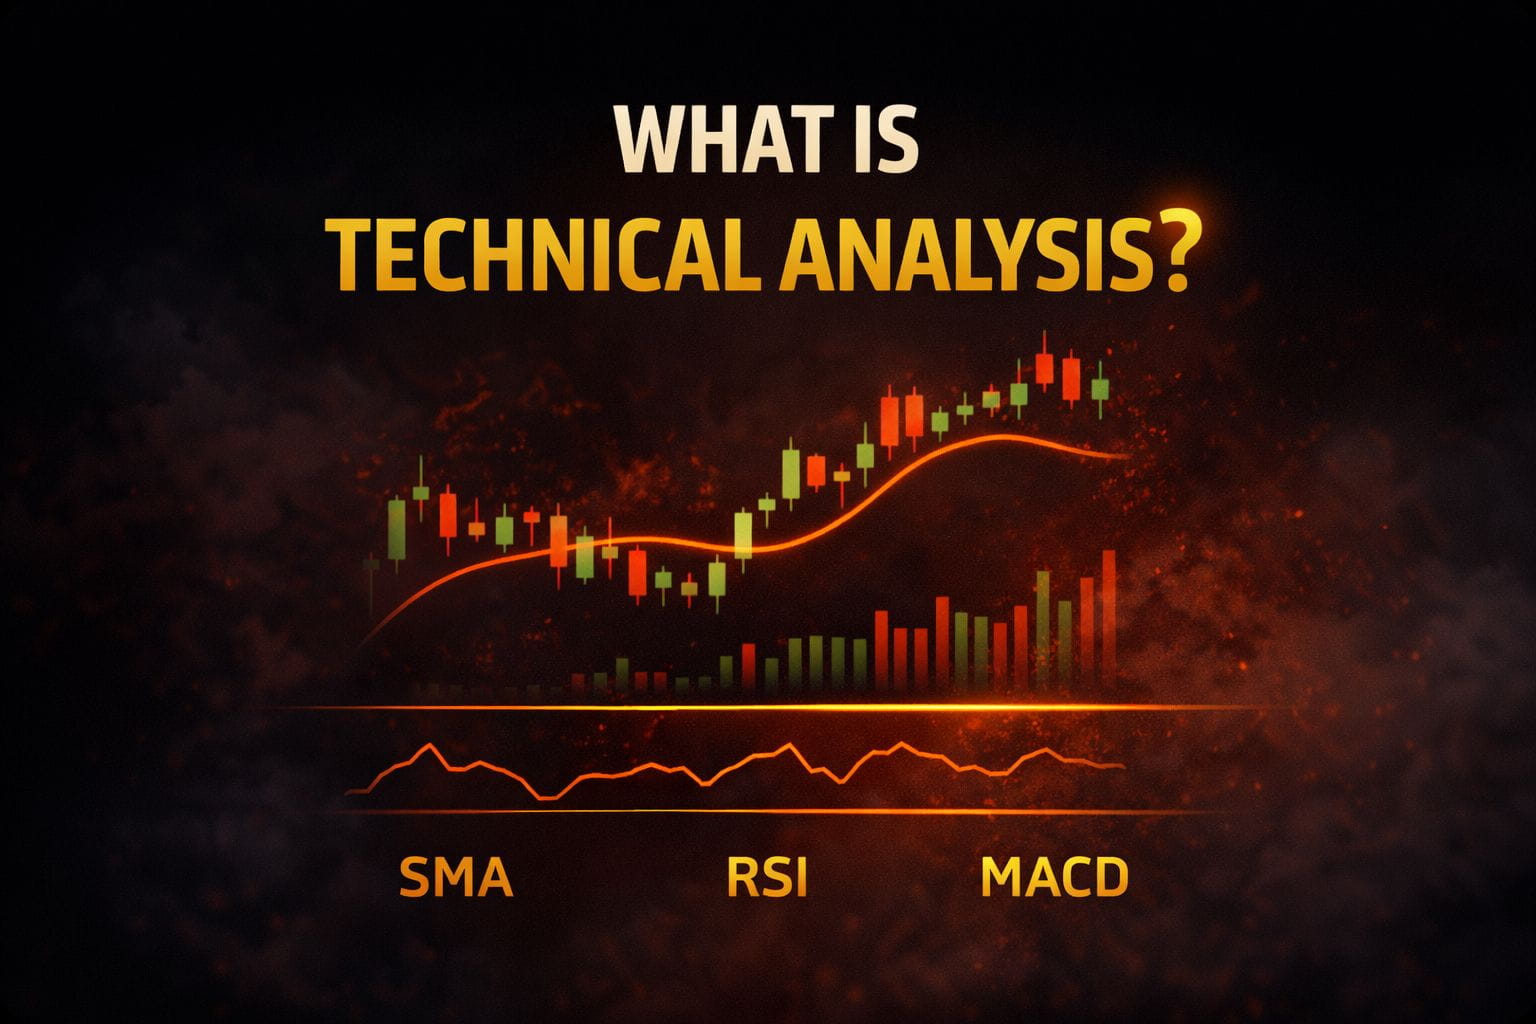
A Quick Look at TA’s Origins :
TA isn’t new.
Early versions appeared in 17th-century Amsterdam and 18th-century Japan.
Modern TA comes from Charles Dow, founder of The Wall Street Journal.
His ideas later became Dow Theory, the backbone of modern chart analysis.
Back then, traders used pen and paper.
Today, we use charts, indicators, and real-time data — but the logic is the same.
How Does Technical Analysis Actually Work?
TA is built on one core belief:
All known information is already reflected in the price.
Price moves because of supply and demand, which are driven by fear and greed.
When buyers dominate → price rises
When sellers dominate → price falls
By studying these movements, traders try to anticipate what comes next.
TA works best in:
High-volume markets
Liquid assets
Normal market conditions
Low liquidity = more noise and fake signals.
Common Technical Indicators (Explained Simply)
1️⃣ Moving Averages (MA)
SMA: Average price over time (slow & smooth)
EMA: Reacts faster to recent price changes
Used to:
Identify trends
Spot dynamic support & resistance
Catch crossovers (trend shifts)
2️⃣ RSI (Relative Strength Index)
Ranges from 0 to 100
Above 70 → Overbought
Below 30 → Oversold
Great for spotting momentum exhaustion.
3️⃣ Bollinger Bands
Price moves between upper and lower bands
Wide bands = high volatility
Tight bands = low volatility
Helps identify volatility and extremes.
4️⃣ MACD
Tracks momentum and trend strength
Uses EMA relationships
Includes a histogram for confirmation
Often used for trend reversals.
Trading Signals (What Traders Look For)
TA indicators can suggest opportunities like:
Overbought / Oversold (RSI)
Golden Cross / Death Cross (Moving Averages)
MACD Crossovers (Momentum shifts)
⚠️ Important:
Signals are probabilities, not guarantees.
That’s why experienced traders:
Combine multiple indicators
Use stop losses
Avoid over-trading
Criticism of Technical Analysis
TA isn’t perfect, and critics often say:
It’s a self-fulfilling prophecy
Chart reading can be subjective
Sudden news or events can break any setup
Still, supporters argue:
No two traders use TA the same way
Context + experience matters
TA is a tool, not a crystal ball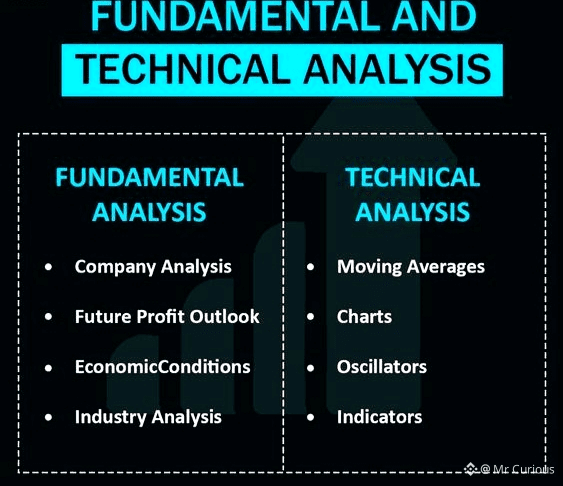
Technical Analysis vs Fundamental Analysis :
Technical Analysis (TA):
Short-term focus
Timing entries & exits
Best for traders
Fundamental Analysis (FA):
Long-term focus
Project value & strength
Best for investors
📌 The smartest approach?
Use both.
Final Thoughts
TA won’t make you rich overnight.
But when combined with discipline, risk management, and confirmation, it becomes a powerful edge.
Whether you’re a day trader or a long-term investor, understanding TA helps you:
Avoid emotional decisions
Read market sentiment
Trade with structure instead of hope
Price doesn’t lie — emotions do. 📊🔥
Follow @Mr Curious for Regular Educational and Crypto Content ✨


#TechnicalAnalysis #FundamentalAnalysis #BinanceSquare #WriteToEarnUpgrade #BTC100kNext?