 Stop Overcomplicating Trading
Most traders lose money because they're trying to learn 47 different strategies at once.
Support/resistance bounce. Cup and handle. Head and shoulders. Inverse head and shoulders. Double tops. Triple bottoms. Bullish flags. Bearish pennants. Ascending triangles. Descending wedges.
It's exhausting. And unnecessary.
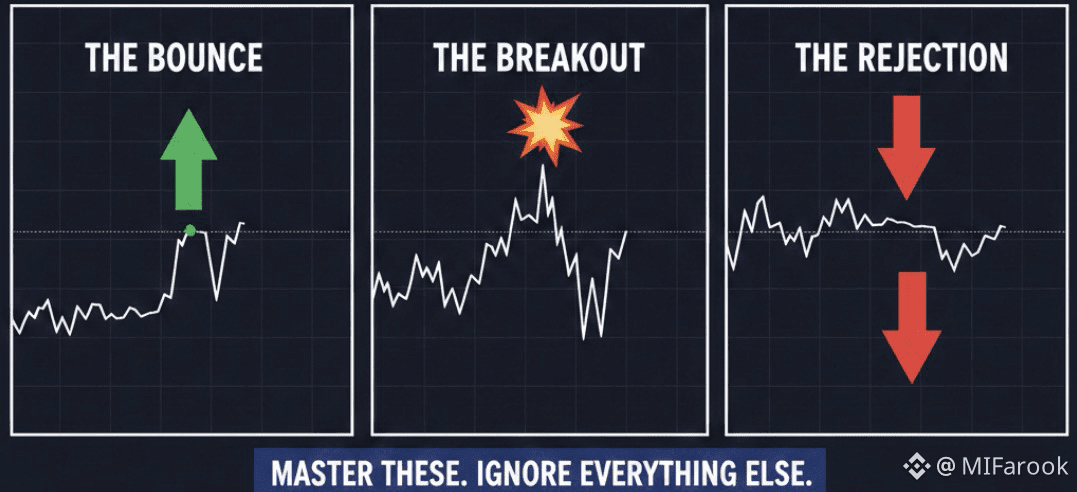
Three setups. That's all you need. They work in bull markets, bear markets, and sideways chop.
Here's exactly what they are.
Setup #1: The Support Bounce
What it is:
Price drops to a level where it bounced before. It bounces again. Entry on the bounce.
Why it works:
Support levels are where buyers historically showed up. They often show up again at the same spot.
Think of support like the floor of a room. Price can bounce off it multiple times before it eventually breaks through.
How to identify it:
Find a price level that rejected downward moves at least 2-3 times before
Wait for price to drop back to that level
Watch for volume to spike as price touches support
Look for a bounce candle (green candle with a long lower wick)
Entry rules:
Enter when price closes above support with strong volume
Stop loss just below the support level (usually 2-5% below)
Target is the next resistance level above
Example:
Bitcoin support at $91,000. It bounced there three times in the past month.
Price drops to $91,200. Volume spikes. Big green candle forms.
Entry: $91,500 Stop loss: $90,500 (below support) Target: $95,000 (next resistance) Risk/Reward: 1:3.5
What kills this trade:
Buying before confirmation (price might keep dropping)
Stop loss too tight (normal volatility stops you out)
No volume on the bounce (means buyers aren't really there)
Typical success rate: Around 60-65%
Setup #2: The Breakout
What it is:
Price has been stuck below a resistance level. Finally breaks through with conviction. Entry on the breakout.
Why it works:
When resistance breaks with volume, it often becomes new support. Price tends to run after breaking major levels.
How to identify it:
Find a resistance level price tested multiple times but couldn't break
Watch for a strong candle that closes clearly above resistance (not just a wick)
Volume must be 2-3x higher than average
Look for continuation - price should stay above the breakout level
Entry rules:
Enter on the retest of breakout level (when price comes back down to test the old resistance as new support)
OR enter immediately if volume is massive and the move might continue without pullback
Stop loss below the breakout level
Target is measured move (distance from support to resistance, projected upward)
Example:
ETH stuck below $3,400 for two weeks. Tests it 5 times, can't break.
Suddenly breaks to $3,450 on 3x normal volume.
Option A - Aggressive entry:
Entry: $3,450 (right on breakout)
Stop: $3,350 (below breakout level)
Target: $3,700 (measured move)
Option B - Conservative entry:
Wait for pullback to $3,400
Entry: $3,410 (on retest)
Stop: $3,350
Target: $3,700
What kills this trade:
Fake breakouts with no volume (breaks then immediately falls back)
Chasing too late (buying after it already ran 10%)
Not waiting for retest (FOMO entry before confirmation)
Typical success rate: Around 55-60%
Pro tip: The best breakouts happen after long consolidation periods. The longer price compressed, the bigger the eventual move.
Setup #3: The Rejection
What it is:
Price pumps into resistance. Gets rejected hard. Short it or wait to buy lower.
Why it works:
Resistance is where sellers historically showed up. When price gets rejected with volume, it often drops back to support.
How to identify it:
Find a clear resistance level
Watch price pump into that level
Look for rejection candle (long upper wick, closes near the low)
Volume should spike on the rejection
Entry rules (for shorting):
Enter when price closes below the rejection candle
Stop loss above the resistance level
Target is next support level below
Entry rules (for buying lower):
Watch it drop
Wait for it to hit support
Then use Setup #1 (Support Bounce)
Example:
SOL keeps getting rejected at $160. Four times in two weeks.
Price pumps to $162. Big red candle with long upper wick. Volume spikes.
Short entry: $157 (after rejection confirmed) Stop loss: $163 (above resistance) Target: $145 (next support)Risk/Reward: 1:2
What kills this trade:
Shorting too early (before rejection confirms)
Resistance breaks instead of rejecting (stop loss gets hit)
Trying to catch the exact top (greedy entry)
Typical success rate: Around 50-55%
Reality check: Shorting in crypto is risky. Many traders use this setup mainly to know when NOT to buy, and where to wait for better entries.
How These Setups Work Together
The full cycle:
Price bounces off support (Setup #1 - buy signal)
Price rises and tests resistance (watch zone)
Price either breaks resistance (Setup #2 - continuation signal) OR gets rejected (Setup #3 - exit signal)
If rejected, price drops back to support (Setup #1 again)
This is how markets move. Up and down between support and resistance. Over and over.
The strategy: Buy near support. Sell near resistance. Repeat.
The Tools Needed
For finding levels:
TradingView with basic candlestick chart
Horizontal line tool (for marking support/resistance)
Volume indicator (already built-in)
That's it. No fancy indicators. No paid tools.
How to mark levels:
Look at the past 30-90 days. Find prices where:
Multiple bounces happened
Big volume showed up
Clear reversals occurred
Those become support and resistance zones.
Position Sizing for Each Setup
Setup #1 (Support Bounce): 2-3% risk
Higher confidence. Support has proven itself multiple times.
Setup #2 (Breakout): 1.5-2% risk
Medium confidence. Breakouts can fail.
Setup #3 (Rejection/Short): 1% risk
Lower confidence. Shorting crypto is dangerous. Resistance can break unexpectedly.
Common Mistakes to Avoid
Mistake: Trading every setup that appears
Fix: Only take trades with at least 1:2 risk/reward. If it's not there, skip it.
Mistake: Entering before confirmation
Fix: Wait for the candle to close. FOMO costs more than missed trades.
Mistake: Moving stop loss
Fix: If the stop gets hit, the trade was wrong. Accept it. Moving stops turns small losses into big ones.
Mistake: No volume confirmation
Fix: No volume = no conviction = no trade. Period.
What The Numbers Show
Traders using just these three setups consistently report:
Win rate: 55-65% (varies by market conditions)
Average win: 6-10%
Average loss: 2-4%
Monthly returns: 15-40% in trending markets, 5-15% in choppy markets
Not life-changing overnight. But consistent. Profitable. Repeatable.
Why These Work
They're based on how markets actually move
Support and resistance aren't magic. They're just price levels where buying and selling pressure historically shifted.
They're visual
No complex calculations. These setups are instantly visible on any chart.
They're universal
Work on Bitcoin. Work on altcoins. Work on stocks. Work on any timeframe.
They're simple
Simple is sustainable. Complex strategies fall apart under pressure.
What About Other Setups?
There are dozens more. Head and shoulders. Falling wedges. Bull flags.
Do they work? Sometimes.
Should beginners trade them? Rarely.
Why? Because mastering three setups beats being mediocre at twenty.
Action Plan
Week 1:
Open TradingView
Pick 3 coins to follow
Mark support and resistance levels on each
Watch for these three setups
Don't trade yet - just observe
Week 2:
Paper trade these setups. Track results in a journal.
Week 3:
Start with real money. Small positions. 1% risk maximum.
After one month:
Review the journal. Which setup had the best results? Focus on that one.
The Bottom Line
Success in trading doesn't come from knowing everything.
It comes from knowing a few things really well.
These three setups are boring. They're repetitive. They've been around forever.
They work.


