Markets have a language of their own, and right now, the technical structure is speaking clearly but not recklessly. Momentum is strong, conviction is visible, and trend signals are aligning in a way that commands attention. At the same time, caution is whispering in the background, reminding experienced participants that strength and sustainability are not always the same thing.
This is the kind of market moment that rewards patience, perspective, and professionalism.
Let’s break down what the technical signals are really saying and more importantly, how seasoned market participants interpret them.
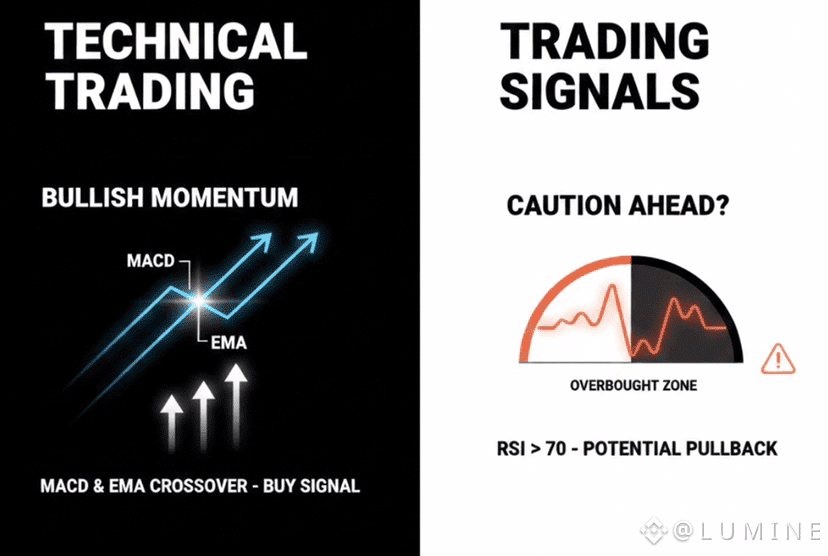
Bullish Momentum Is Confirmed, Not Assumed
One of the most respected confirmations of trend strength comes from MACD crossovers. When momentum indicators align to the upside, they don’t just suggest optimism they validate it.
A bullish MACD crossover reflects:
Accelerating buying pressure
Strengthening trend direction
A shift in market control toward buyers
This isn’t a random spike or emotional move. It’s a structural signal that momentum is building, often following a period of accumulation or consolidation.
When MACD turns bullish, it tells us the engine is running and running efficiently.
EMA Crossovers: Trend Structure Is Taking Shape
Alongside MACD, Exponential Moving Average (EMA) crossovers provide clarity on trend formation. EMAs react faster to price changes, making them a favorite among traders who value precision.
A bullish EMA crossover typically signals:
A transition from consolidation to expansion
Short-term strength overtaking long-term hesitation
Buyers asserting control over price direction
When price holds above key EMAs, it reinforces confidence that the trend is not fragile it’s supported.
This alignment between MACD and EMA is what technicians call confluence and confluence is where probabilities improve.
Momentum Traders Are Paying Attention
These combined signals are not invisible to the market. Momentum traders, swing traders, and algorithmic strategies all respond to this type of technical alignment.
That attention creates:
Increased volume
Faster price reactions
Reinforced trend behavior
But here’s where experience separates reaction from strategy.
Momentum is powerful — but unchecked momentum can overextend.
RSI: Strength With a Warning Label
The Relative Strength Index (RSI) plays a very different role in technical analysis. While MACD and EMA focus on trend and momentum, RSI highlights conditions of exhaustion.
A high RSI doesn’t mean the trend is over.
It means the trend is crowded.
When RSI pushes into elevated territory, it signals:
Aggressive buying in a short time frame
Reduced margin for error
Increased likelihood of pullbacks or consolidation
This is not a bearish signal — it’s a risk-awareness signal.
Strong assets can stay overbought longer than expected, but they rarely move in straight lines.
Why This Combination Matters
The real insight isn’t found in a single indicator it’s found in how they interact.
Right now, the technical picture suggests:
Trend direction is clearly bullish
Momentum is accelerating
Market participation is increasing
Short-term overheating is possible
This combination often leads to healthy pauses, not reversals.
And that distinction matters.
Consolidation Is Not Weakness
When RSI runs high while trend indicators remain bullish, markets often do one of two things:
Pull back modestly to reset momentum
Move sideways to absorb buying pressure
Both outcomes are signs of market maturity, not failure.
In fact, consolidation after strong momentum often strengthens the next leg higher. It allows indicators to cool off while structure remains intact.
This is how sustainable trends are built — step by step, not candle by candle.
Smart Money vs. Emotional Money
Emotional participants chase strength without context.
Professional participants respect momentum but manage risk.
They understand that:
Bullish signals attract late entries
High RSI increases volatility risk
Patience often improves positioning
This is why professionals don’t panic during pauses — and don’t overcommit during peaks.
They let the chart breathe.
Why Caution Is a Strategy, Not a Doubt
Caution doesn’t mean disbelief in the trend.
It means preparing for normal market behavior.
High RSI suggests:
Entries should be more selective
Position sizing should be disciplined
Expectations should be realistic
Momentum remains strong — but discipline ensures survival.
And survival is what keeps traders in the game long enough to benefit from major trends.
What This Setup Often Leads To
Historically, this type of technical environment often precedes:
Controlled pullbacks
Range-bound price action
Higher lows forming over time
Renewed momentum after reset
This is not a signal to disengage — it’s a signal to engage intelligently.
The trend is not fragile.
It’s simply asking for balance.
Final Perspective
The charts are telling a nuanced story one that rewards listeners who understand tone, not just volume.
MACD and EMA crossovers confirm strength
Price structure supports continuation
RSI reminds us to respect risk
This is what healthy momentum looks like.
Not reckless. Not exhausted.
Just powerful with boundaries.
In markets like these, the edge doesn’t come from predicting the next candle.
It comes from reading the full picture and acting with intention.
Momentum is on the side of the bulls.
Wisdom decides how far that momentum can be carried.
