📊 This One Chart Explains the Entire Crypto Market
It really doesn’t need to be complicated.
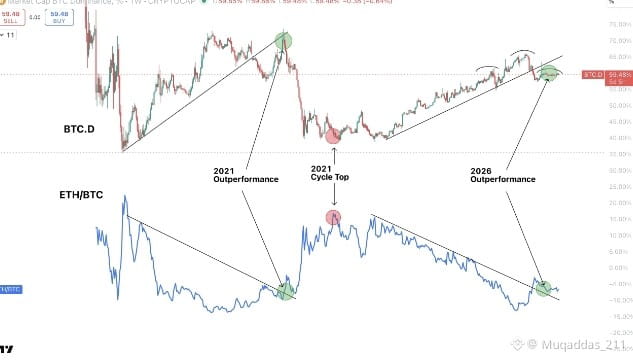
If you want to understand where the market is headed, look at BTC Dominance (BTC.D) and ETH/BTC — that’s it.
This isn’t a random indicator that flips overnight.
This chart shows the core structure of liquidity and capital positioning across crypto.
🔹 Bitcoin is the largest asset.
🔹 Ethereum is second.
BTC dominance rarely breaks trend — and when it does, it’s never random.
A breakdown signals a shift in capital flow, where liquidity starts moving from the top of the market into lower layers.
Now compare: • BTC.D + ETH/BTC at the previous cycle top
• Where we are right now
📐 The structure is almost identical.
🌍 Even more important — it aligns perfectly with global liquidity conditions.
Here’s the part most people get wrong 👇
A drop in BTC dominance does NOT mean Bitcoin is finished.
Historically: ✔️ Bitcoin continues rising
✔️ Dominance falls because capital flows into $ETH and altcoins
That phase only happens when liquidity is expanding.
So if you think the market is “over for another year,”
you’re not being cautious — you’re just early in the wrong direction.
You don’t need: ❌ Dozens of indicators
❌ Complicated narratives
You only need this one chart to understand where we are in the cycle.
🔄 Is this the beginning of capital rotation…
or are you still waiting for confirmation?##BTC #ETH
#BTC #AltSeaason #liquidate #CryptoCycle
⚠️ Disclaimer: Educational content only. No financial advice. Includes third-party opinions