$ZEC Zcash (ZEC) — including price action and technical context, charts, and market sentiment as of today:
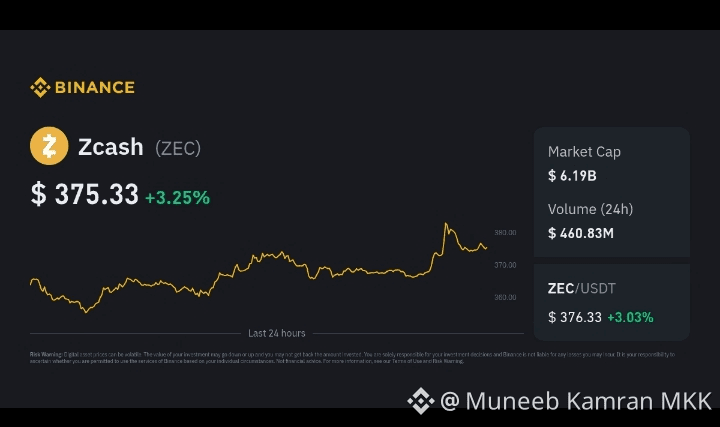
📈 Live Zcash (ZEC) Price Snapshot
Binance-Peg ZEC (ZEC)
$374.76
+$11.16 (3.07%) Today
Live price data from Binance–USD pair.
ZEC price: ~$370–$380 range (fluctuating)
24h range: roughly $355–$383
Recent trend: mixed short-term momentum with some strength but not a decisive breakout.
📊 Current Market Sentiment & Drivers
🟢 Bullish Factors
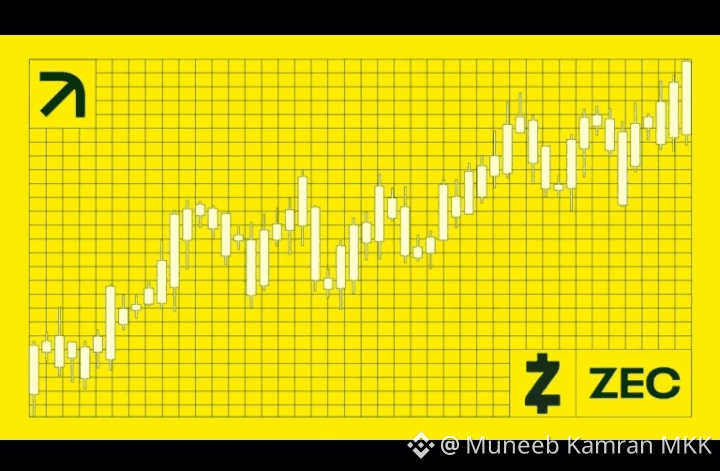
1. Technical Breakouts & Structure
Recent price action has shown breakouts from long term downtrends and triangle patterns, indicating renewed buying pressure and structure bullishness if key levels hold. �
2. Privacy Coin Narrative Re-Emerging
Zcash is gaining attention as privacy concerns grow globally. This has driven shielded supply increases and institutional interest (e.g., trusts, specialized wallets). �
3. Institutional Inflows & Innovation
Products like Grayscale’s Zcash Trust and cross-chain wallet integrations (NEAR intent layer, Zashi wallet) are fueling broader adoption and liquidity. �
4. Large Short-term Gains
At times in late 2025, ZEC saw 8x monthly gains and surpassed $600–$700 ranges — showing the market can move fast in ZEC if momentum returns.
🔴 Bearish / Risk Factors
1. Technical Resistance Zones
Current charts show stiff resistance around $375–$390. Failing to clear these may lead to mild corrections or consolidation. �
2. High Volatility & Pullbacks
Community reports noted a fast drop (~35%) after sharp spikes, typical of highly volatile assets. �
3. Regulatory Pressure on Privacy Coins
Privacy coins face regulatory uncertainties across many markets, which could suppress exchange listings or volume. (General risk for Zcash & competitors)
🔍 Technical Levels to Watch (Short-Term)
Level
Significance
Support ~ $320–$350
Key short-term bounce zone
Resistance ~ $375–$390
Critical breakout point
Bull breakout > $420
Could signal next leg up
Major target > $500+
If momentum and volume increase
(These levels come from chart studies and indicators showing buying strength above moving averages but cooling momentum when RSI/upper bands are high.) �
📉 Mixed Technical Indicators
Different analysis platforms currently show slightly differing signals — some bullish (buy-weighted moving averages) and others bearish (sell signals from RSI/MACD patterns), which highlights market indecision and volatility right now. �
#USJobsData #WEFDavos2026 #TrumpCancelsEUTariffThreat