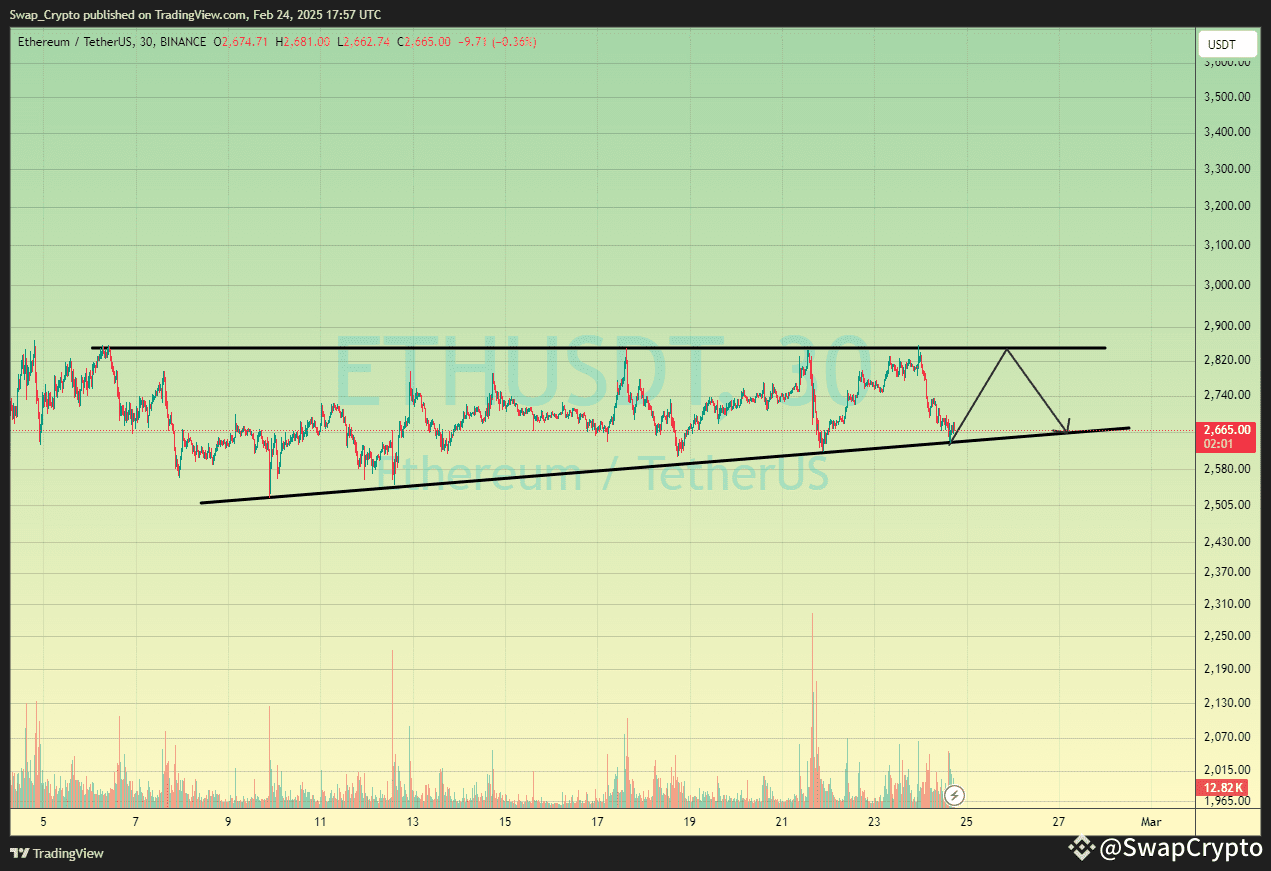
This Ethereum chart is like watching a thrilling rollercoaster ride! 🚀 The price is moving between two important levels—hitting a resistance point around $2,820 and bouncing off support at $2,665. It’s like Ethereum’s stuck in a tug-of-war between these zones. So, will it break out or dip again? 🤔 It’s definitely keeping us on the edge of our seats! 😆 Let’s see what happens next! 🌟
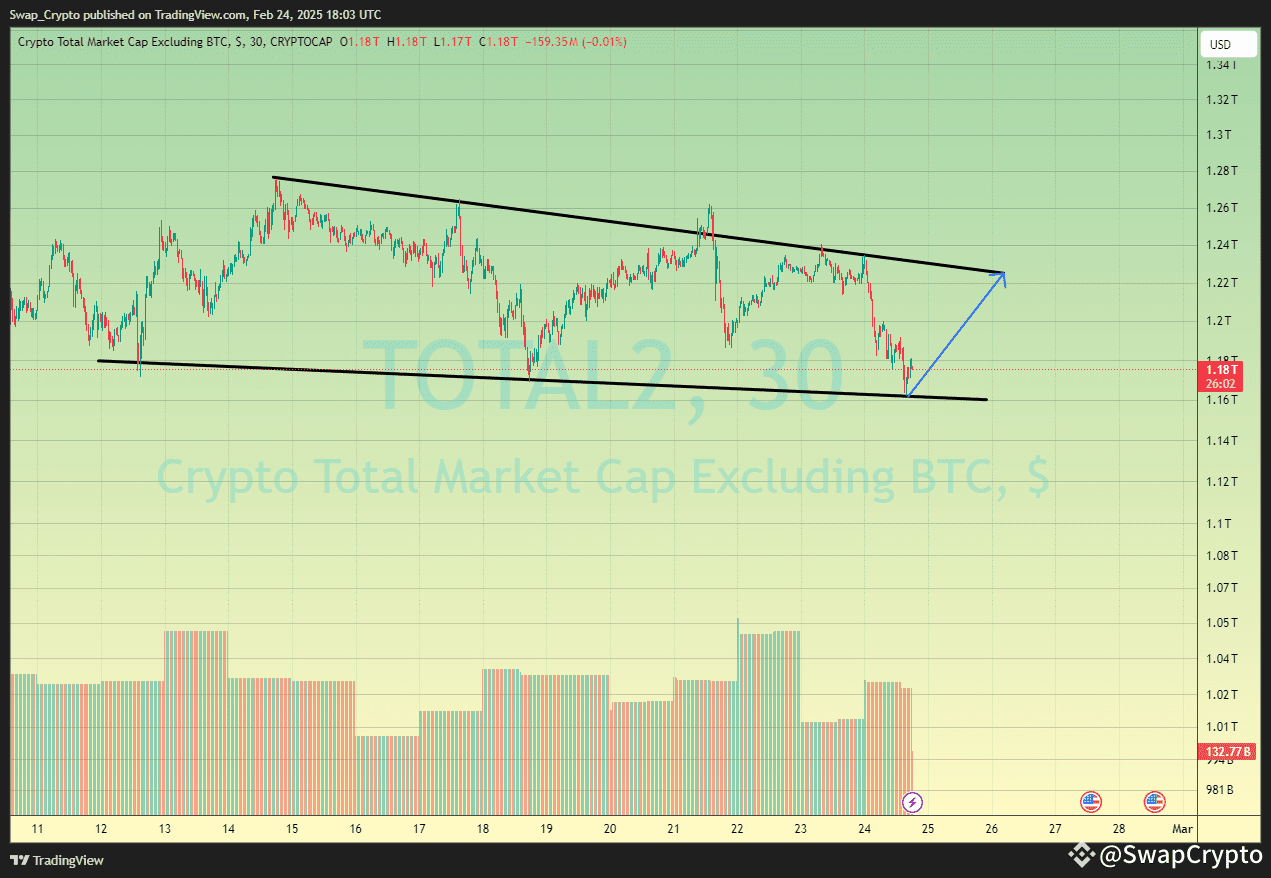
This chart represents the total crypto market cap, excluding Bitcoin. It's showing a downward movement toward the support level, but with a possible breakout ahead, as indicated by the upward trend shown in the chart 🐂. It's like the market took a little nap 💤, but now it might just be waking up and getting ready for a bullish run! 🚀 So, Ethereum could be gearing up for some gains, making it the life of the crypto party. Time to get ready for the ride! 🎢💰
Entry: 2641.95
1st TP: 2751.50
2nd TP: 2826.29
3rd TP: 2858.62
For more details, check out my bio by clicking on my profile.
This signal is for spot trading only. If you're interested in future signals, join my live Binance session.
Simply click on my profile to join!
