
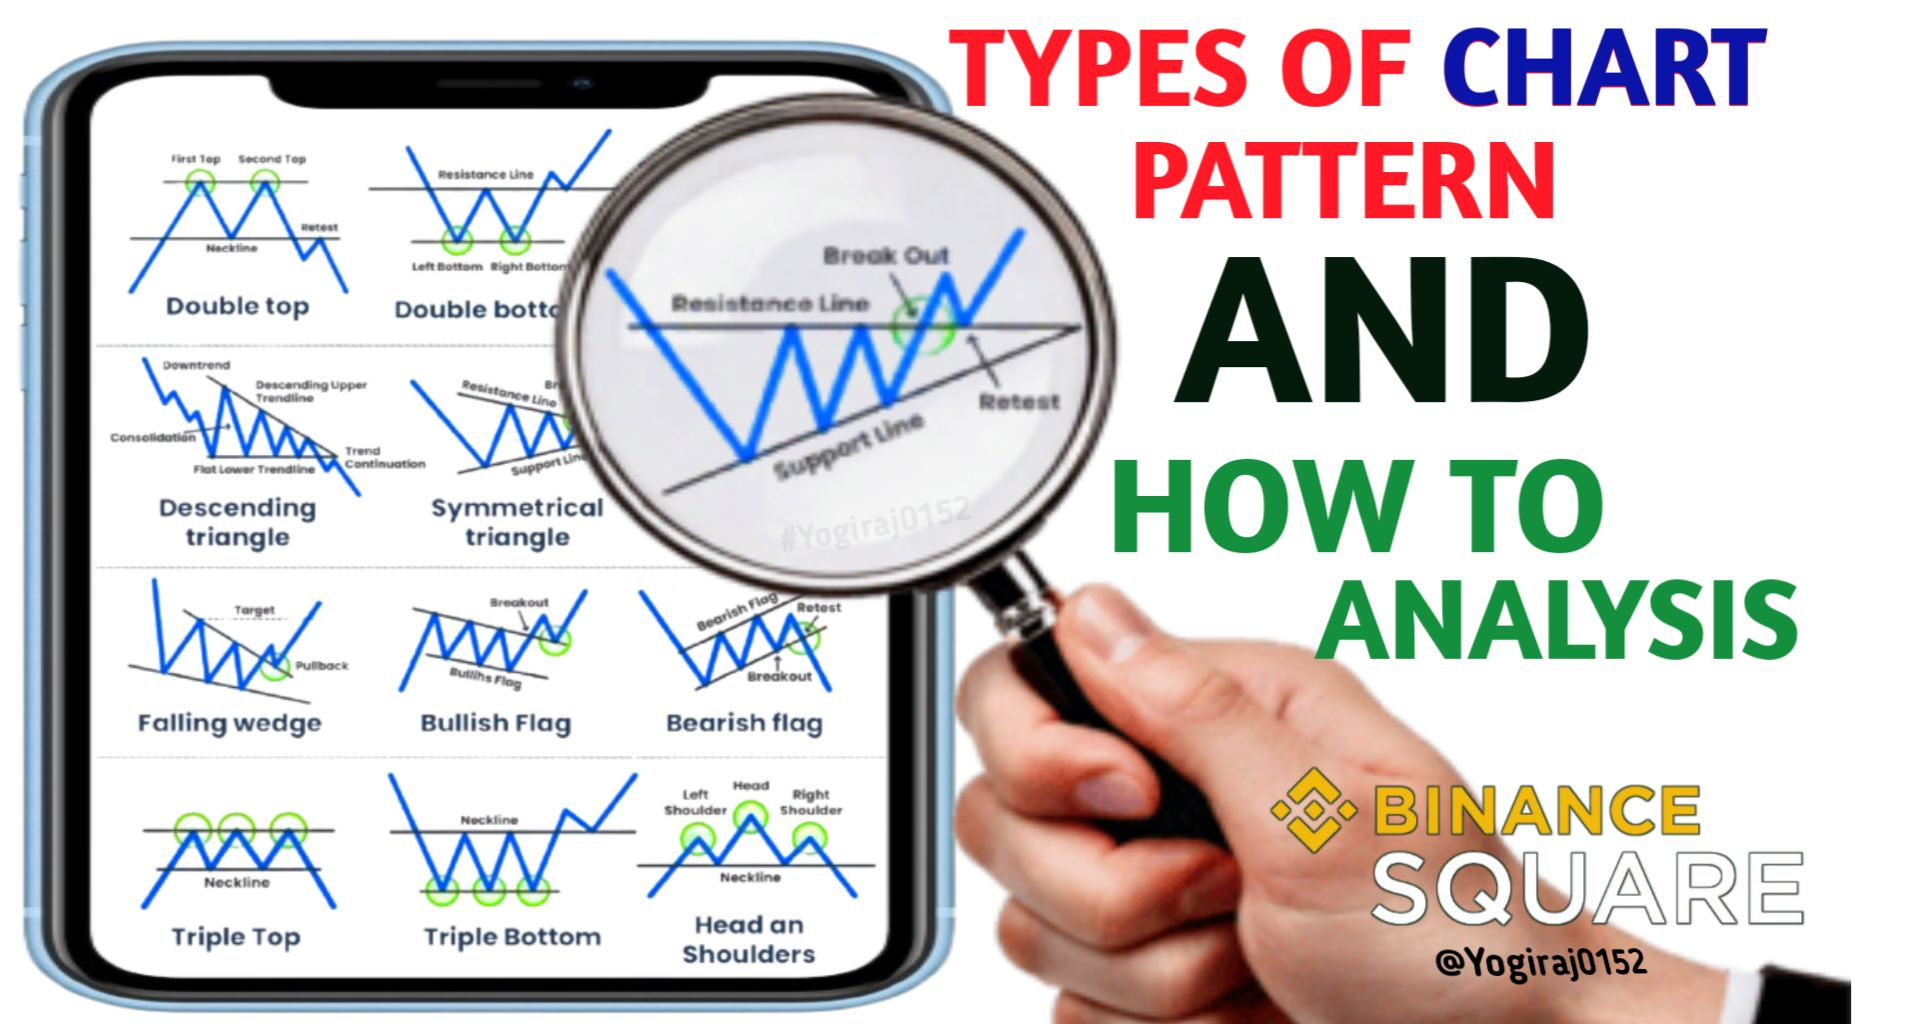
1 👉🏻 Double Top Pattern (M)
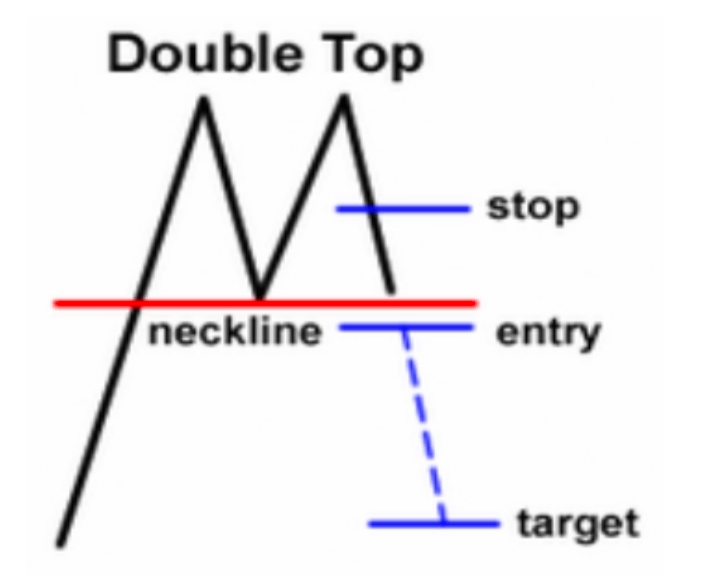
Hits resistance twice and then falls. It seems the bulls are tired and the bears are taking control. Price hits resistance twice and falls back down.
2 👉🏻 Double Bottom Pattern (W)
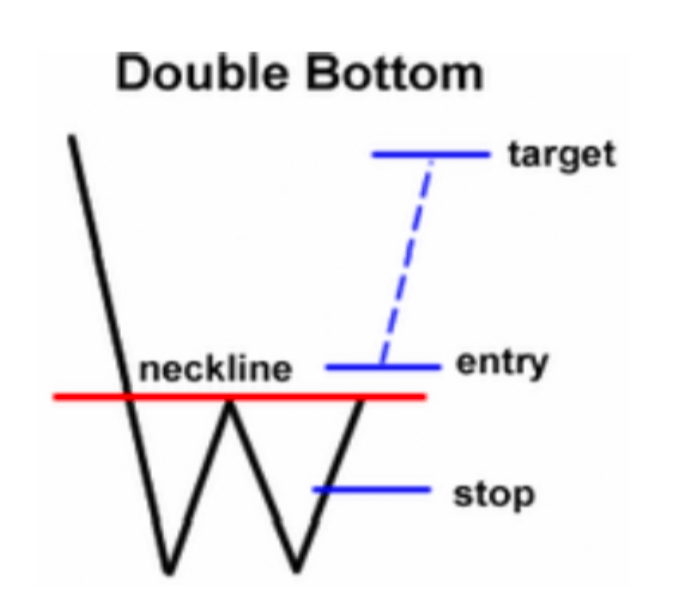
Hits support twice and then bounces. It seems the bears are weakening and the bulls are making a comeback. Price bounces twice off support and rises.
3 👉🏻 Triple Top Pattern
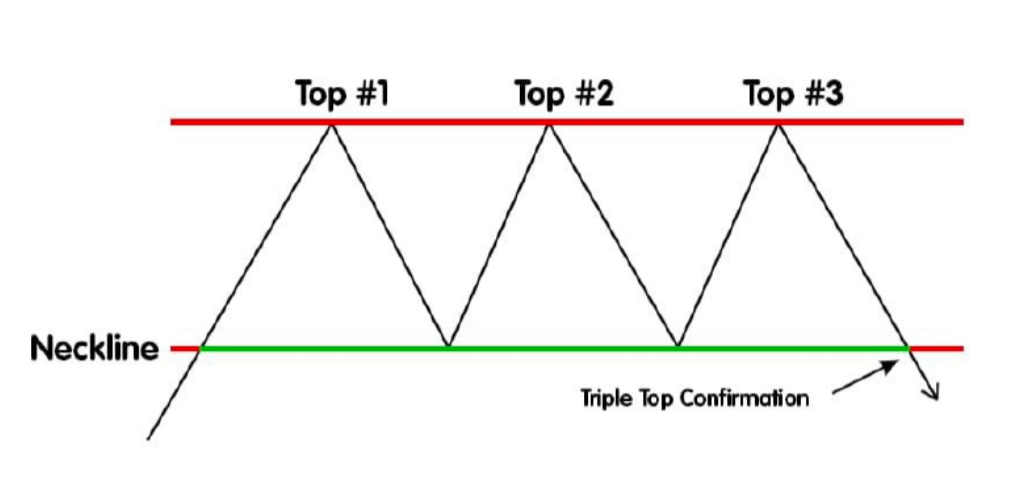
Rise above and then slides three times. A sign of strong resistance, a possible trend reversal. Price fails three times at the same resistance level.
4 👉🏻 Triple Bottom Pattern
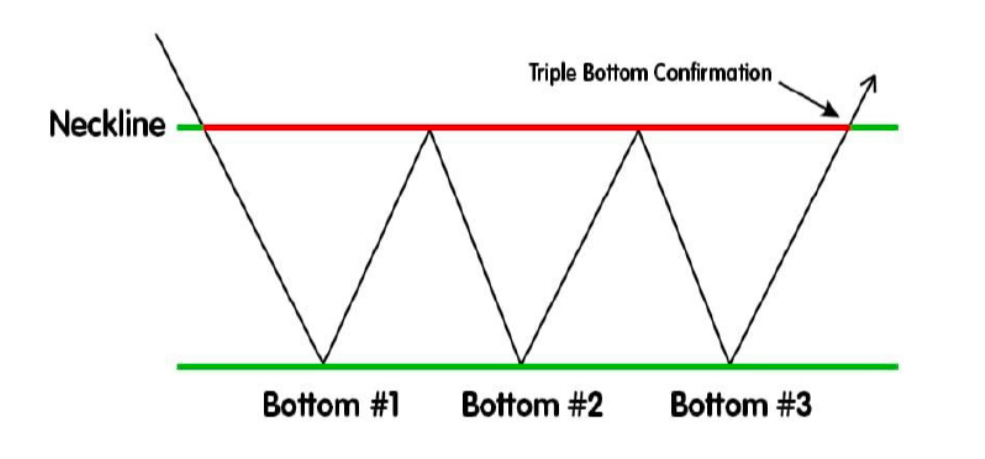
Rise below and pause three times. A sign of strong support, a possible uptrend. Price holds three times at the same support level.
5 👉🏻 Bullish Pennant
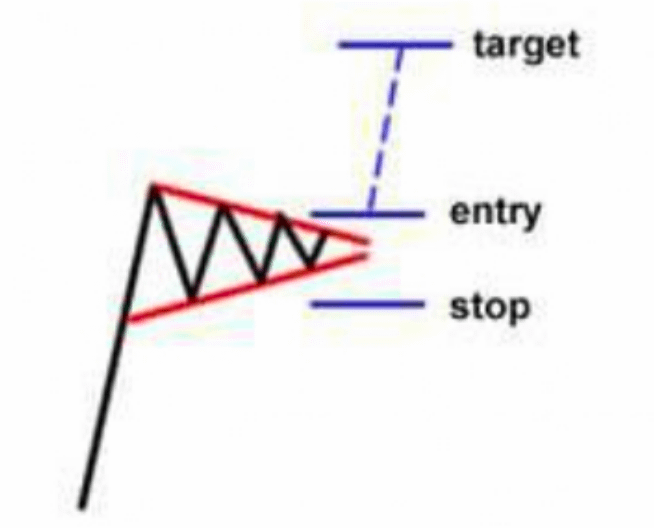
A brief consolidation after a sharp uptrend. It seems like a flag, taking a breather before rising again. A brief consolidation after a strong rally before continuing up.
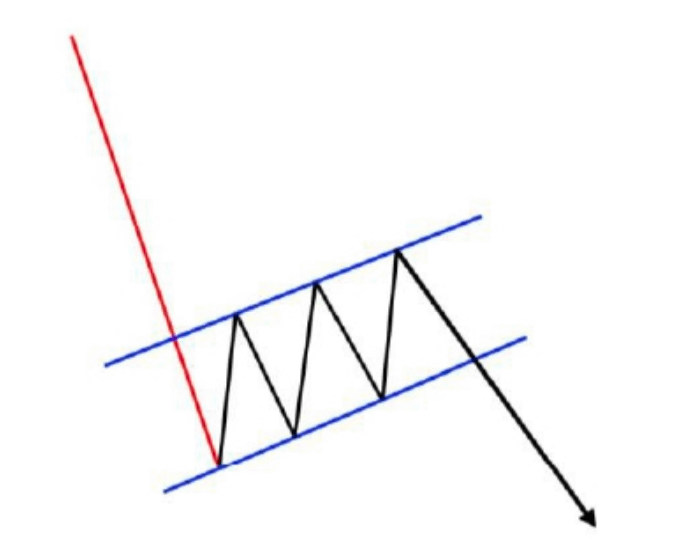
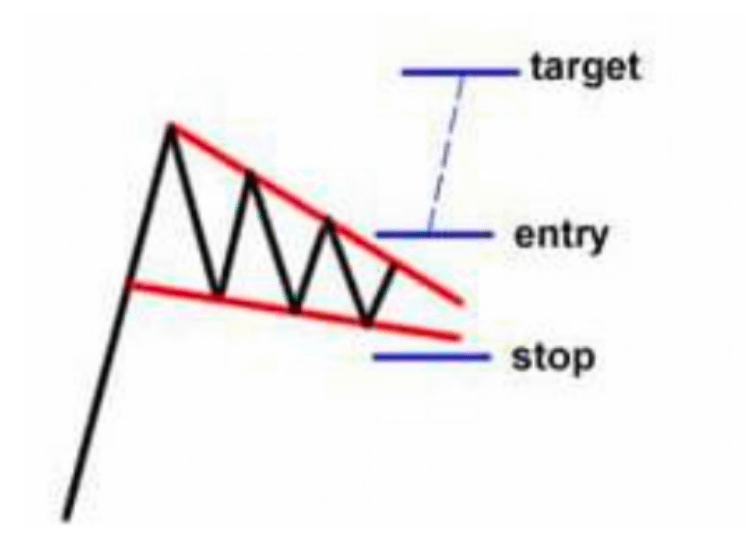
6 👉🏻 Bearish Pennant
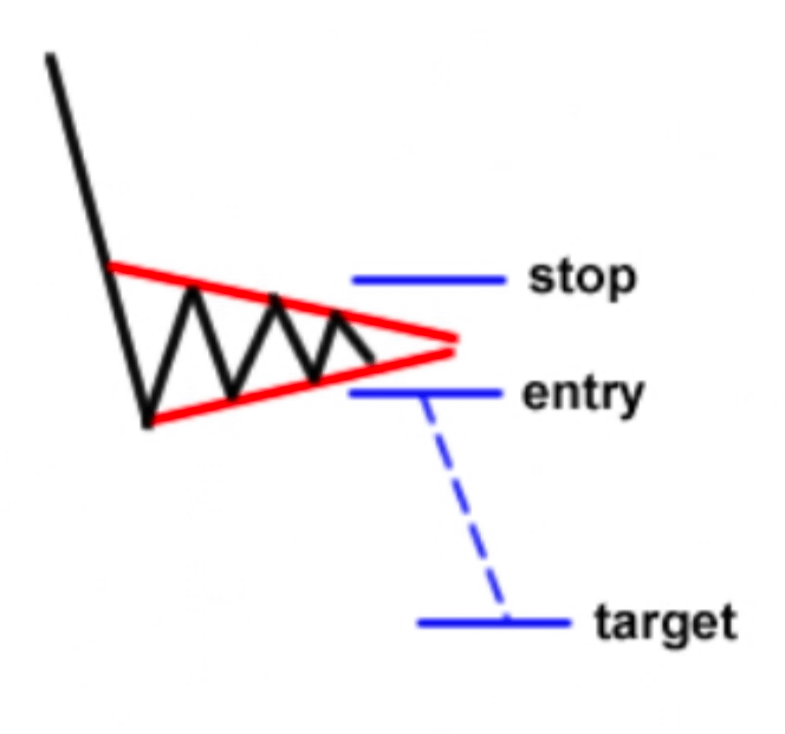
A brief consolidation after a sharp downtrend. A brief pause in the downtrend, then a reversal of momentum. A brief consolidation after a strong drop before continuing down.
7 👉🏻 Bullish Flag Pattern
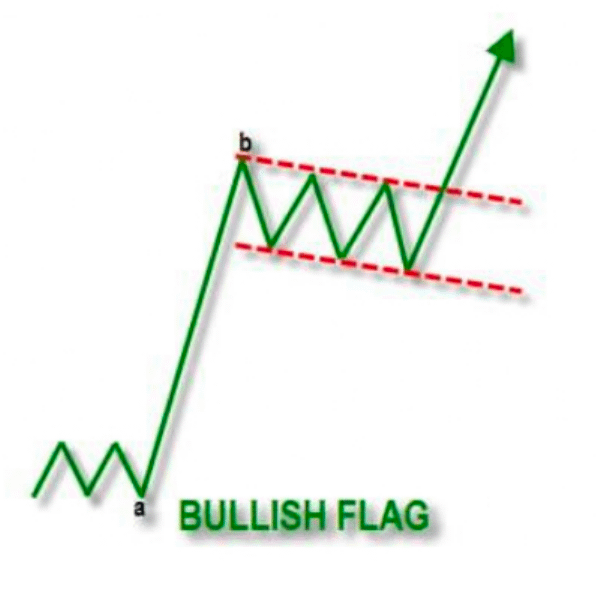
A brief downtrend in an uptrend. Signals the trend resuming after a temporary pause. A small pullback in an uptrend before resuming higher.
8 👉🏻 Bearish Flag Pattern
A small upward slope in a downtrend. After a brief recovery, the decline resumes. A small rally in a downtrend before resuming lower.
9 👉🏻 Bullish Rectangle
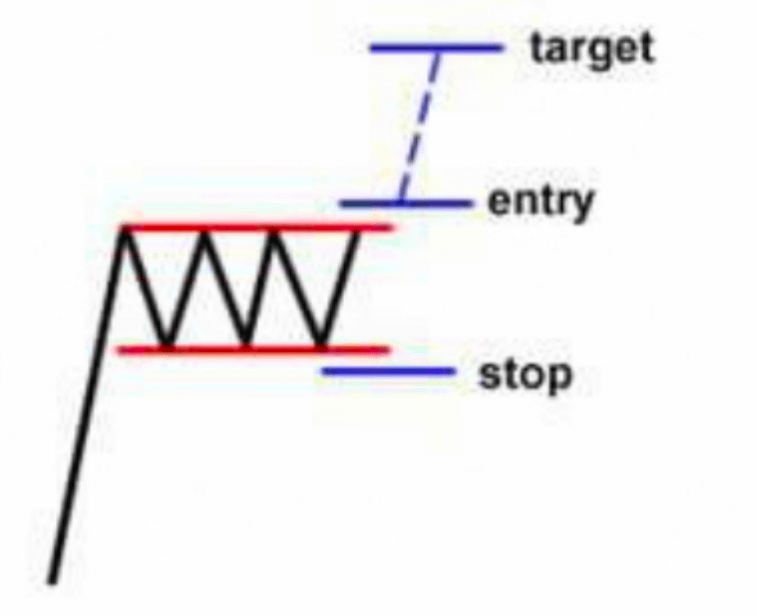
The price moves within a parallel box, but buying pressure persists. Eventually, an upward breakout occurs. Price moves sideways in a range, then breaks upward.
10 👉🏻 Bearish Rectangle
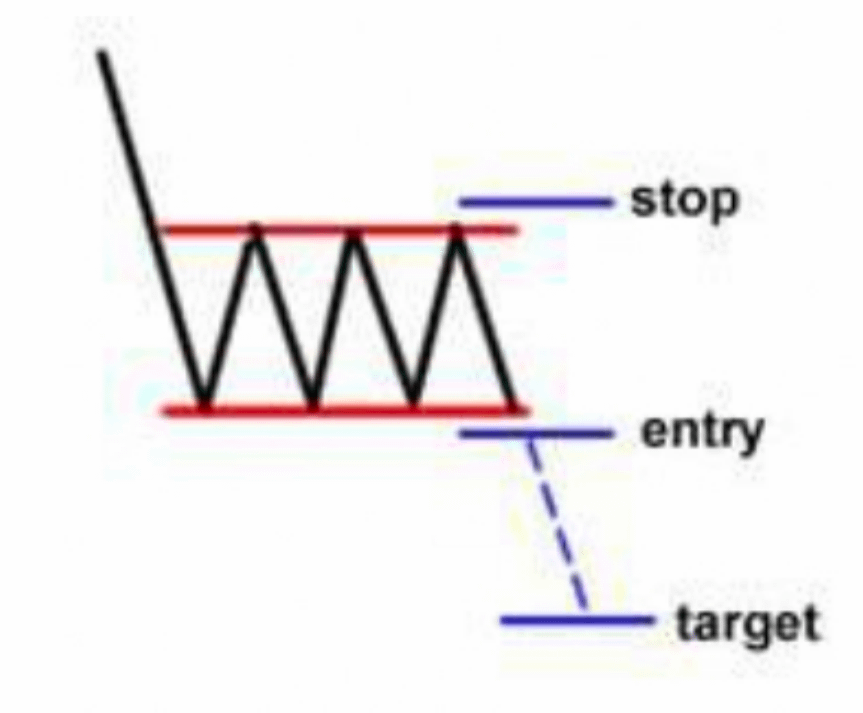
The price remains trapped within a box, but selling pressure persists. Eventually, a downward breakout occurs. Price moves sideways in a range, then breaks downward.
11 👉🏻 Rising Wedge
The price moves up, but the range narrows. This usually signals a downtrend, even if the price is on the upside. Price rises but the range narrows usually breaks downward.
12 👉🏻 Falling Wedge
The price moves down, but the range narrows. This often signals a bullish rally, even if the price is on the downside. Price falls but the range narrows; usually breaks upward.
13 👉🏻 Head and Shoulders
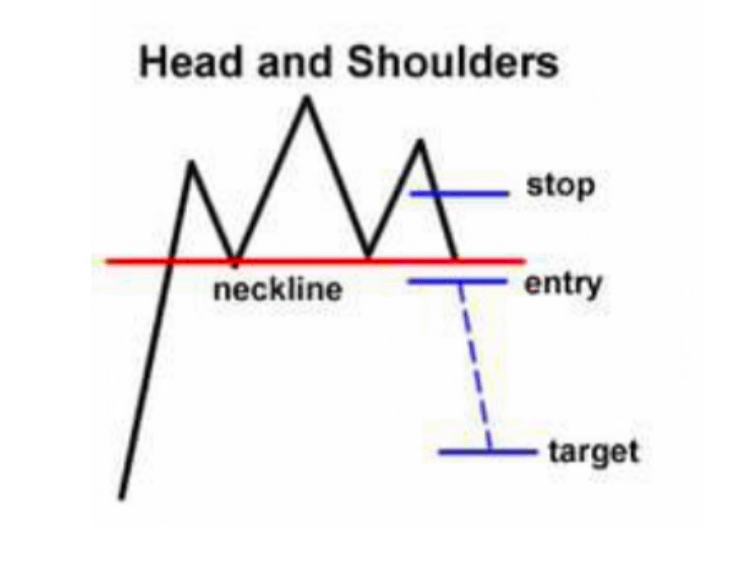
A central high (head) and slightly lower lows (shoulders) on either side. A classic sign of a trend reversal, indicating a downtrend. Middle peak (head) with two lower peaks (shoulders) signals a reversal down.
14 👉🏻 Inverted Head and Shoulders
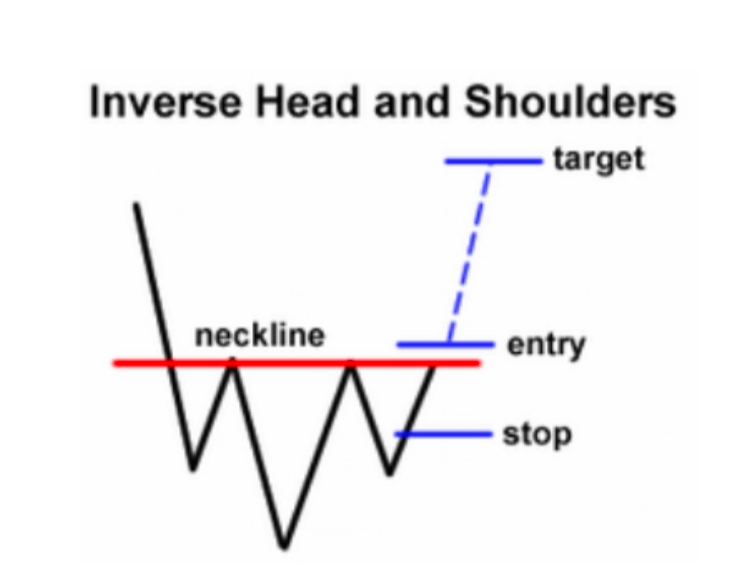
A lower trough (head) in the center and slightly higher troughs (shoulders) on either side. This signals a reversal from bearish to bullish. Middle low (head) with two higher lows (shoulders) signals a reversal up.
15 👉🏻 Symmetrical Triangle
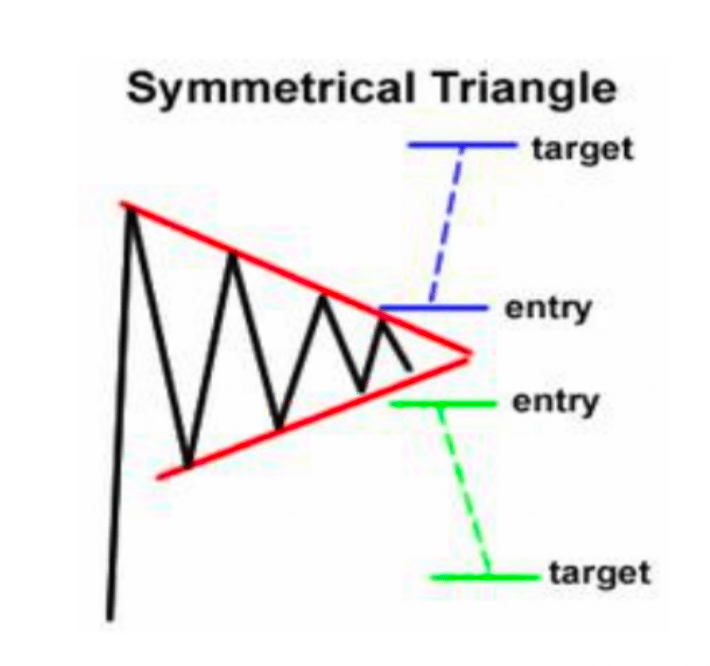
The price contracts from both the top and bottom. This indicates that the market is establishing direction. The direction of the breakout will be the direction of the new trend. Price squeezes between two converging lines; break can be in either direction.
16 👉🏻 Ascending Triangle
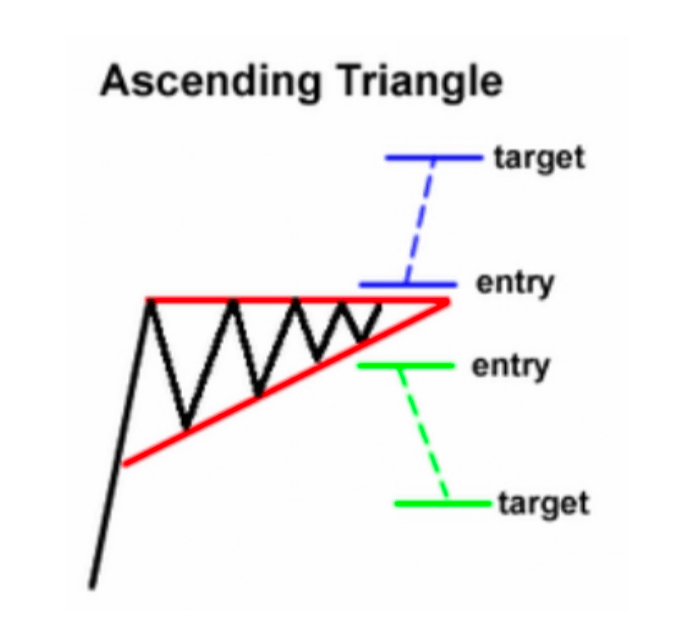
A similar resistance line above, but the support below increases. Buyer pressure is visible, and an upward breakout is often observed. Flat top with rising bottom; bullish breakout likely.
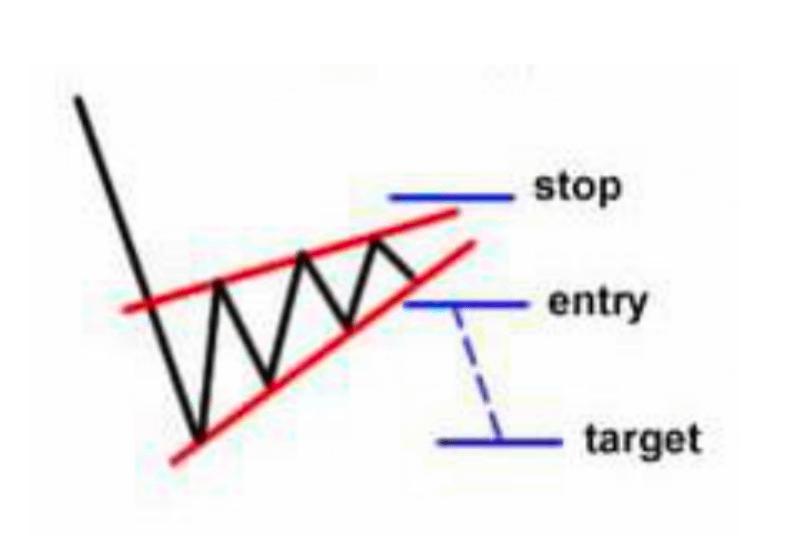
17 👉🏻 Descending Triangle
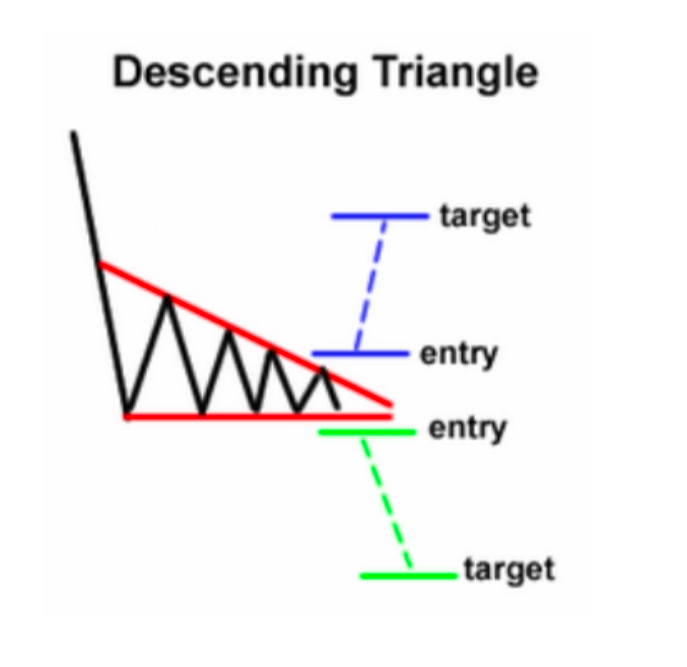
A similar support line below, but the resistance above decreases. Seller pressure is visible, and a downward breakout is likely. Flat bottom with declining top; bearish breakout likely.
18 👉🏻 Cup and Handle
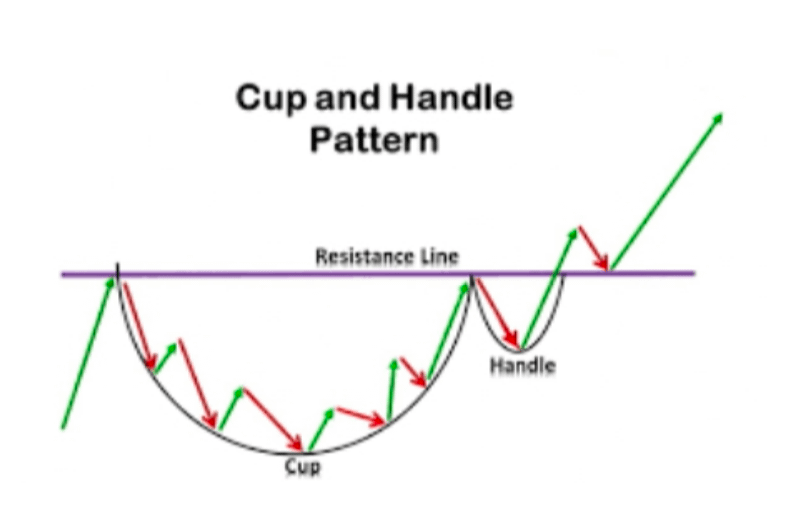
A 'U'-shaped cup forms, followed by a small downward correction (handle). This is followed by a bullish breakout, indicating a longer trend. Rounded bottom (cup) followed by a small dip (handle) before rising.
19 👉🏻 Rounding Bottom
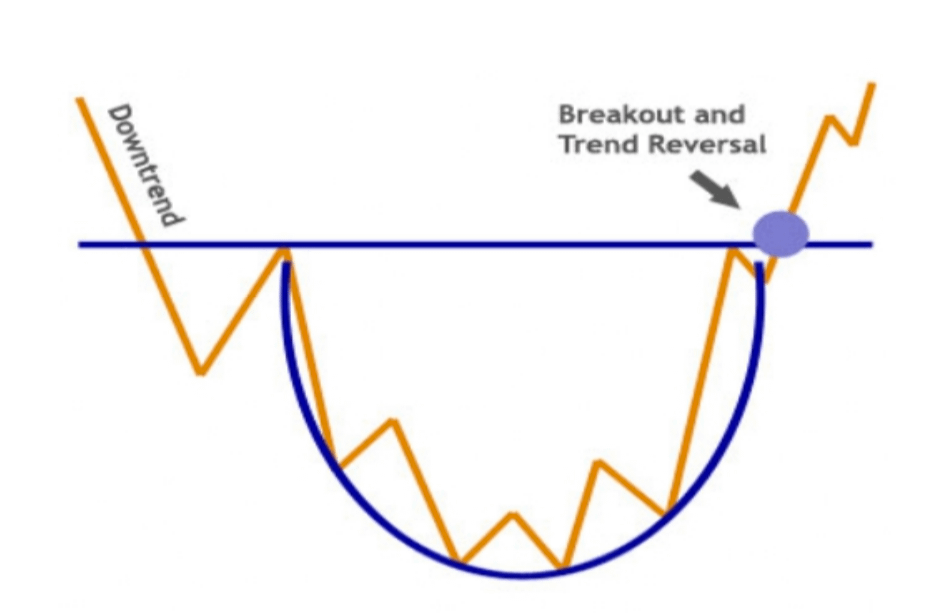
The price gradually falls, then slowly rises, forming a bowl-like shape. This is a calm and reliable signal of a bearish to bullish trend. Slow U-shaped recovery after a downtrend.
20 👉🏻 Diamond Top
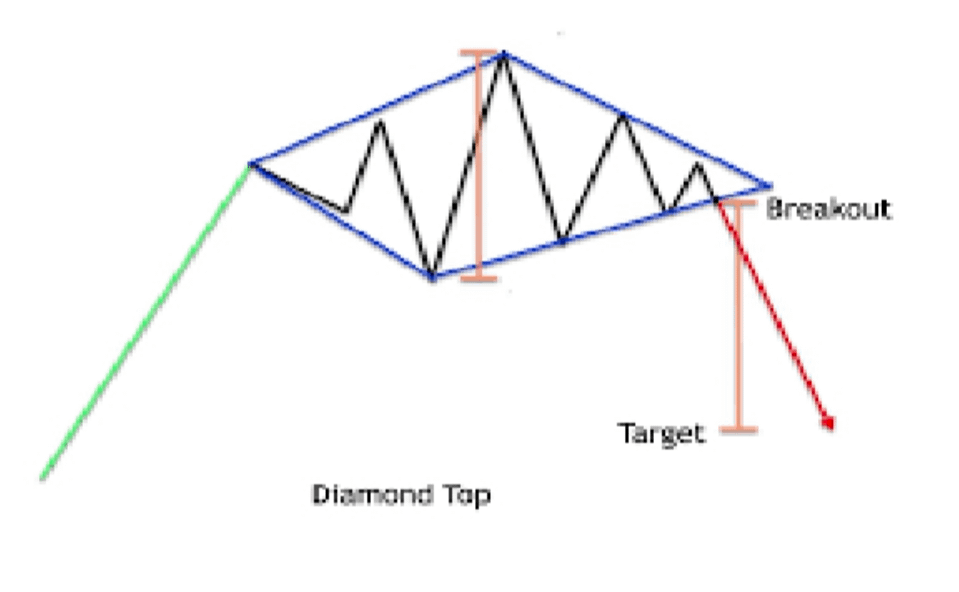
The price moves in a diamond shape, first expanding and then contracting. This usually warns of a trend reversal at a higher level. Expanding then contracting price action, often a top reversal.
21 👉🏻 Diamond Bottom
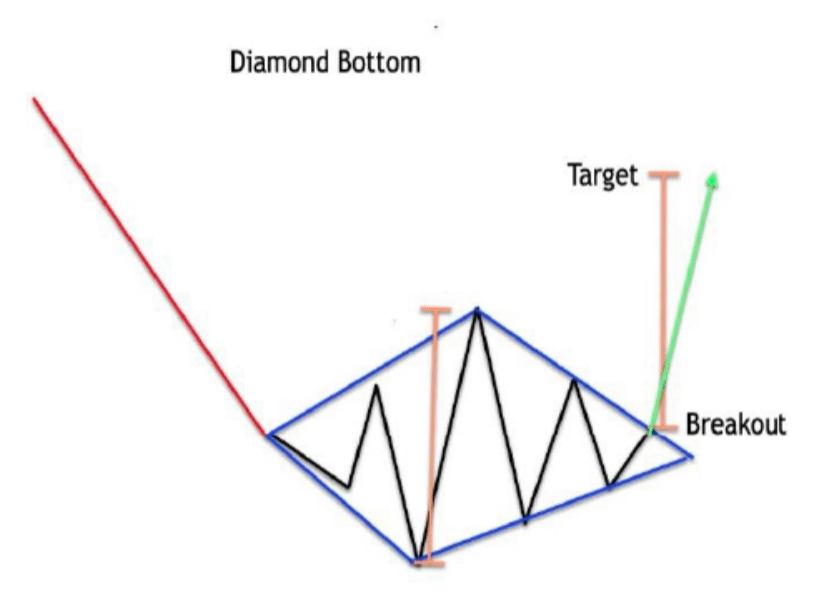
A diamond shape forms, but at the lower end of the trend. This may signal a potential bullish reversal after a decline. Expanding then contracting price action, often a bottom reversal.
How to analyze candlestick patterns?
To analyze them, look not just at the shape, but at its context. What trend is the pattern forming in? What is the volume like? Is there any strong support or resistance? Each candle is a story of the battle between buyers and sellers. Single candles (such as hammers and shooting stars) provide psychological signals, while patterns with two or three candles (such as engulfing harami) confirm a trend change. These are not viewed alone, but in conjunction with larger chart patterns and trends to give accurate signals.
Each candlestick tells a story of battle between buyers and sellers, the body and wicks show who is winning.


#chartpattern #CandlestickPatterns #binancesquareofficial #Yogiraj0152 #TrendingTopic
👉🏻If you like👍🏻 the article, then 💛like and share, if you want to say something related to the article, then comment, we will definitely reply. ✅Follow us so that all our upcoming articles, posts, videos can reach you. If you have got some good information from our post then you can also give us tips. 😊Thank you for reading the post!🙏
⚠️ DISCLAIMER:
This post is for educational / informational purposes only. Nothing contained herein should be construed as financial advice, investment advice, or a recommendation. The crypto market is highly risky. Conduct your own research and consult a financial advisor before making any decisions. The author / page is not liable for any profits / losses.
"Act at your own risk.”