Current Market Snapshot
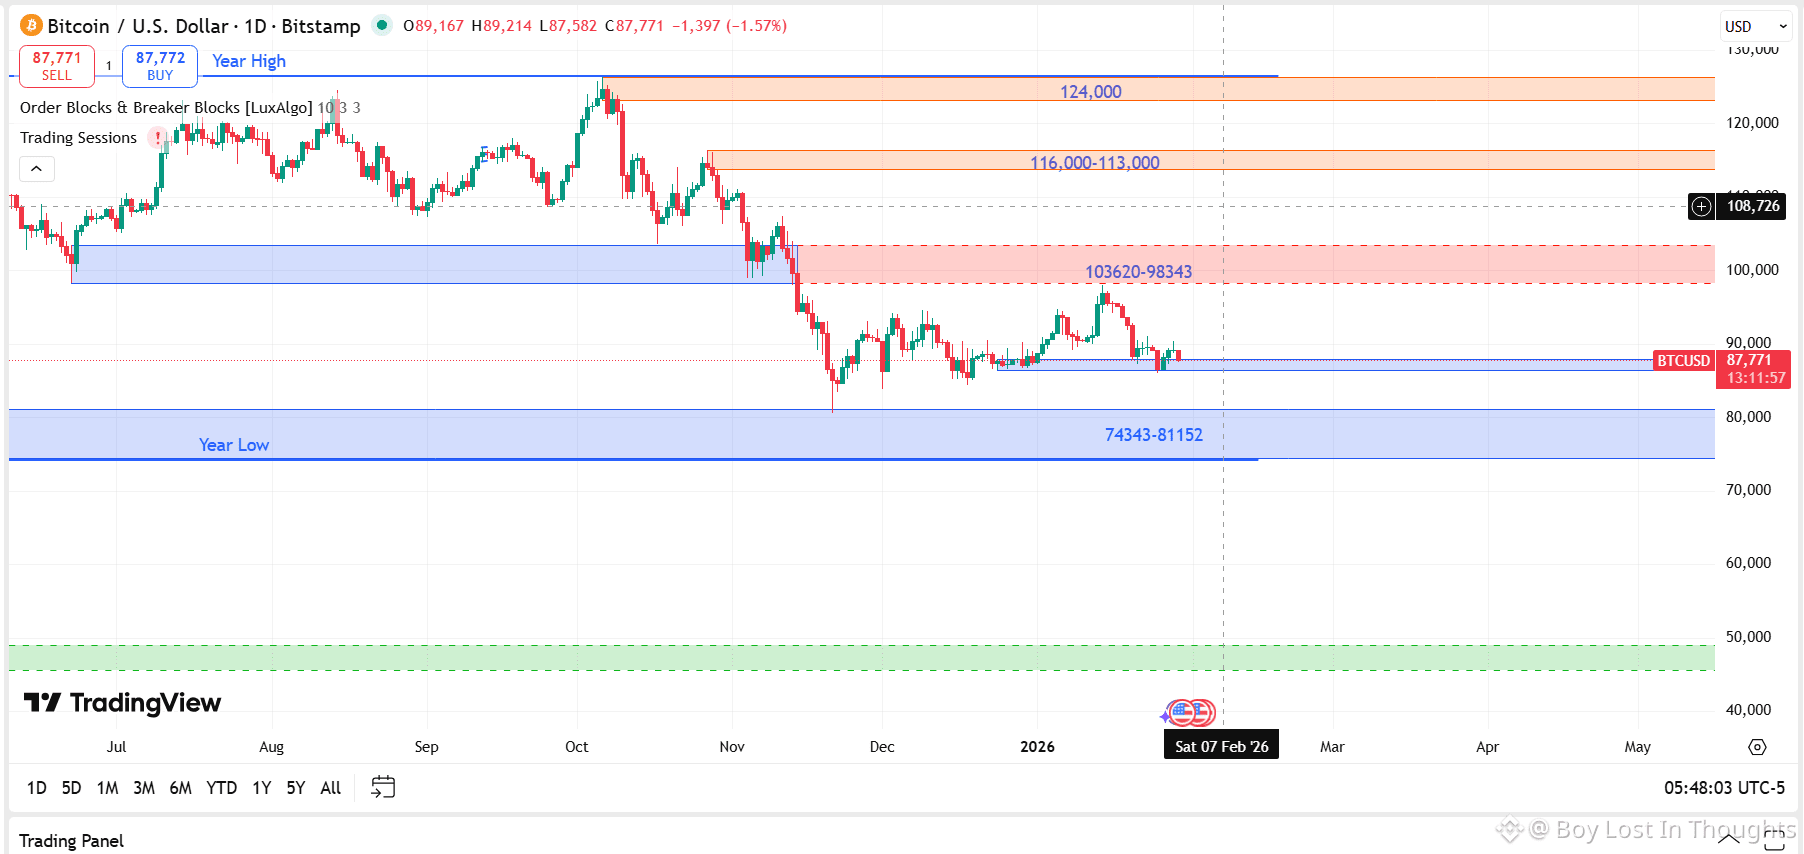
Current Price: $87,771 USD
Daily Change: -1.57% (-$1,397)
Daily Range: $87,582 (Low) to $89,214 (High)
Trading Platform: Bitstamp
Timeframe: Daily (1D) chart
Key Technical Observations
Immediate Price Action
Bitcoin is trading below the key $89,167 opening level
Shows clear bearish momentum with a 1.57% daily decline
Current price ($87,771) is near the daily low ($87,582)
Critical Support & Resistance Levels
Year Low Zone: $74,343 - $81,152 (providing major psychological support)
Upper Resistance: $124,000 (previous high)
Resistance Cluster: $116,000 - $113,000 range
Recent Break Level: $108,726
Market Structure
The chart displays Order Blocks & Breaker Blocks via LuxAlgo indicator
Trading sessions show clear pattern of distribution
Price has declined significantly from February 2026 highs
Chart Context & Timeline
Displayed Time Period: July through December (2026)
Price Range Shown: $40,000 to $720,000 (full historical context)
Current Trading: Near lower end of recent range
Key Takeaways for Traders
Bearish Dominance: The -1.57% daily decline suggests continued selling pressure
Support Test: Price is testing immediate support near $87,500
Volume Context: The chart includes volume data (1,347,000 USD) indicating moderate activity
Wider Context: Despite current decline, Bitcoin maintains position well above yearly lows
Technical Tools: Indicators suggest defined order blocks that may provide future reversal zones
Risk Assessment
Downside Risk: Break below $87,500 could target $81,152 (year low zone)
Upside Potential: Recovery above $89,214 could retest $108,726 resistance
Market Sentiment: Current momentum favors bears, but yearly low support remains untested
Final Note
Bitcoin is experiencing typical volatility within its established range. The proximity to yearly lows provides both risk and opportunity—traders should monitor the $87,500-$89,200 zone for next directional clues while respecting the larger support at $81,152-$74,343.


