BTC is testing $75,000 while Barry (Michael Burry) warns of a corporate death spiral
Today the price $BTC is trading around $76,637 after testing the level of $75,355, which is the lowest price since the end of 2024. This surge occurred against the backdrop of Michael Burry, an investor known for shorting the housing market in 2008, warning that corporate Bitcoin holders risk a deadly spiral if prices fall another 10%.
Burry warns of a corporate bitcoin crash
Michael Burry sharply warned on Monday, calling Bitcoin a speculative bet rather than a true hedge. He noted that while gold and silver have risen due to concerns over a weakening dollar, Bitcoin has not reacted, undermining its narrative as a store of value.
Burry's main concern is focused on corporate balances. He warned that if Bitcoin drops another 10% from current levels, Strategy, the largest corporate holder of Bitcoin, will be deeply in the red and may lose access to financing. He said miners will be next.🤔
This warning matters, considering Burry's track record (Michael Burry). His thesis on the "death spiral" suggests that forced selling by troubled corporate holders could trigger cascading liquidations, lower prices, and create even more troubled sellers in a reflexive feedback cycle.
Bitcoin is now down 40% from October highs, confirming the concerns of those doubting the viability of corporate treasury strategies built around a volatile asset.
Spot outflows continue at $54 million
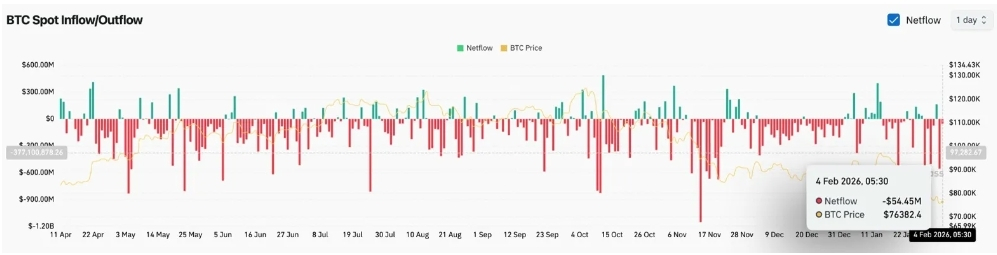
Coinglass data shows $54.45 million in spot outflows on February 4, continuing the distribution pattern that has defined the last two weeks. Selling pressure from spot markets confirms that holders are reducing exposure rather than accumulating at lower levels.
The flow scheme at the end of January and beginning of February shows steady net outflows without significant days of accumulation. When spot selling continues during a crash, it signals seller conviction and raises questions about where natural buying demand will emerge.
If Burry's thesis is confirmed and corporate holders begin to force sell, spot outflows could accelerate significantly from current levels.
The daily RSI reaches overbought territory
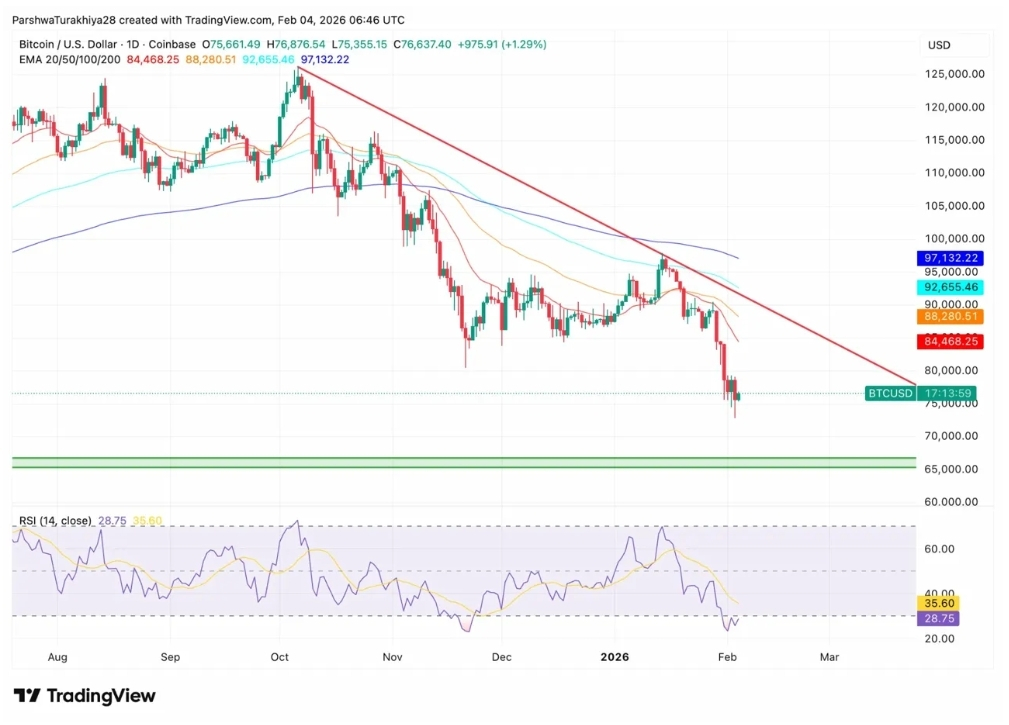
On the daily chart, Bitcoin is trading significantly below all four major EMAs in a downtrend channel that has defined price action since October. The 20-day EMA is at 84,468💲, the 50-day is 88,280💲, the 100-day is 92,655💲, and the 200-day is 97,132💲.
RSI fell to 28.75, the first time since the November 2024 correction entering the oversold zone. While oversold readings can precede rebounds, they do not guarantee reversals without price action support and improved flows.
The descending trend line since October continues to limit rallies, with prices consistently reaching lower highs and lower lows. The horizontal support zone at 65,000💲 represents the next major demand area if 74,000💲 is not realized.
The short-term structure shows contraction of the Bollinger bands
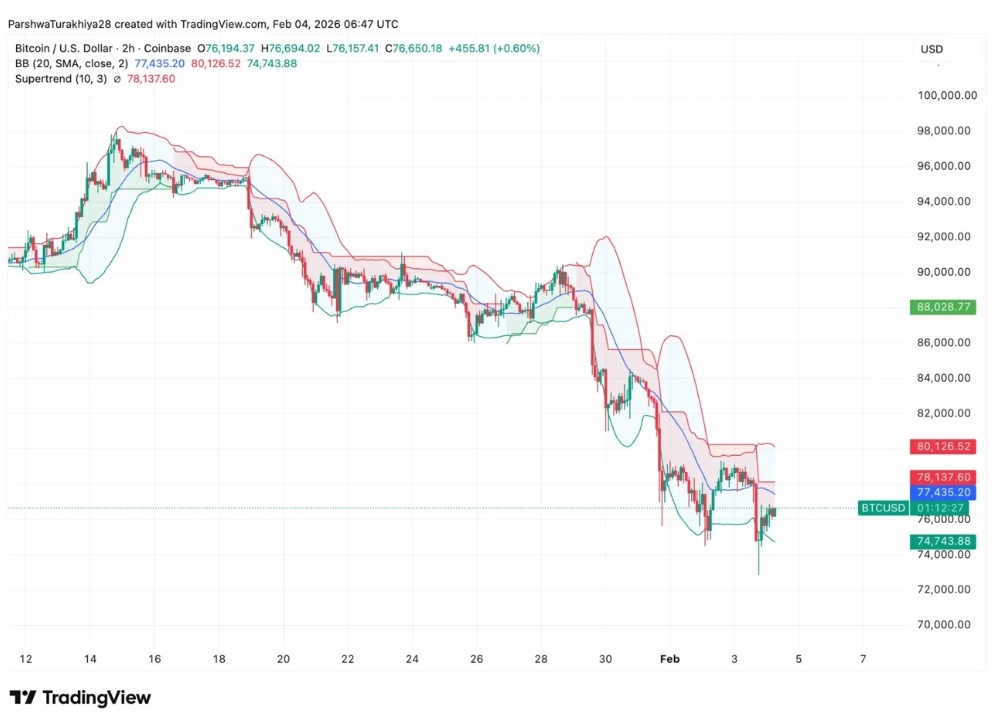
On the two-hour chart, Bitcoin broke below the lower Bollinger band at 74,743💲, and then rebounded to 76,650💲. The 20-period SMA is at 77,435💲, which is immediate resistance for any recovery attempt.
The Supertrend indicator remains bearish at 78,137💲, confirming a short-term downtrend. The price is trying to reclaim the lower Bollinger band after an oversold flush—a pattern that may signal short-term stabilization.
The upper Bollinger band at 80,126💲 represents the first significant resistance zone. Bulls need a close above this level to signal a change in momentum. Until then, rebounds remain relief rallies within a broader downtrend.
Outlook: Will the price of Bitcoin rise?
The trend remains firmly bearish, while the price trades below the EMA cluster, and the risk of corporate selling looms.
Bullish argument:
A daily close above 84,468💲 will return the 20-day EMA and signal that the 75,000💲 zone marked a local bottom. This move requires stabilization of corporate sentiment and improvement in spot flows.
Bearish case:
A close below 74,000💲 will confirm that Burry's "death spiral" theory is in motion and target the demand zone at 65,000💲. Given the pressure on corporate balances and the persistence of spot outflows, such a scenario is quite likely.

@Slavansmart #BNB_Market_Update #BinanceSquareFamily #BTC走势分析
Did you find this analysis helpful?👆
Subscribe to daily token updates as well as to $BTC and $ETH ! 🚀 If you have questions about this trend, leave them in the comments below. #Write2Earn
Do you want me to help you create a specific post or analyze which coins are currently trending at #Binance ?
DYOR - Do Your Own Research