In the expanses of social network X, I stumbled upon quite a sizable fan group of the coin $HBAR . Perhaps among my readers there are also holders and fans of this coin; let's take a look at it from the perspective of technical analysis. We have an upward trend, with distinct price explosions, interestingly the time between them is exactly 4 years.
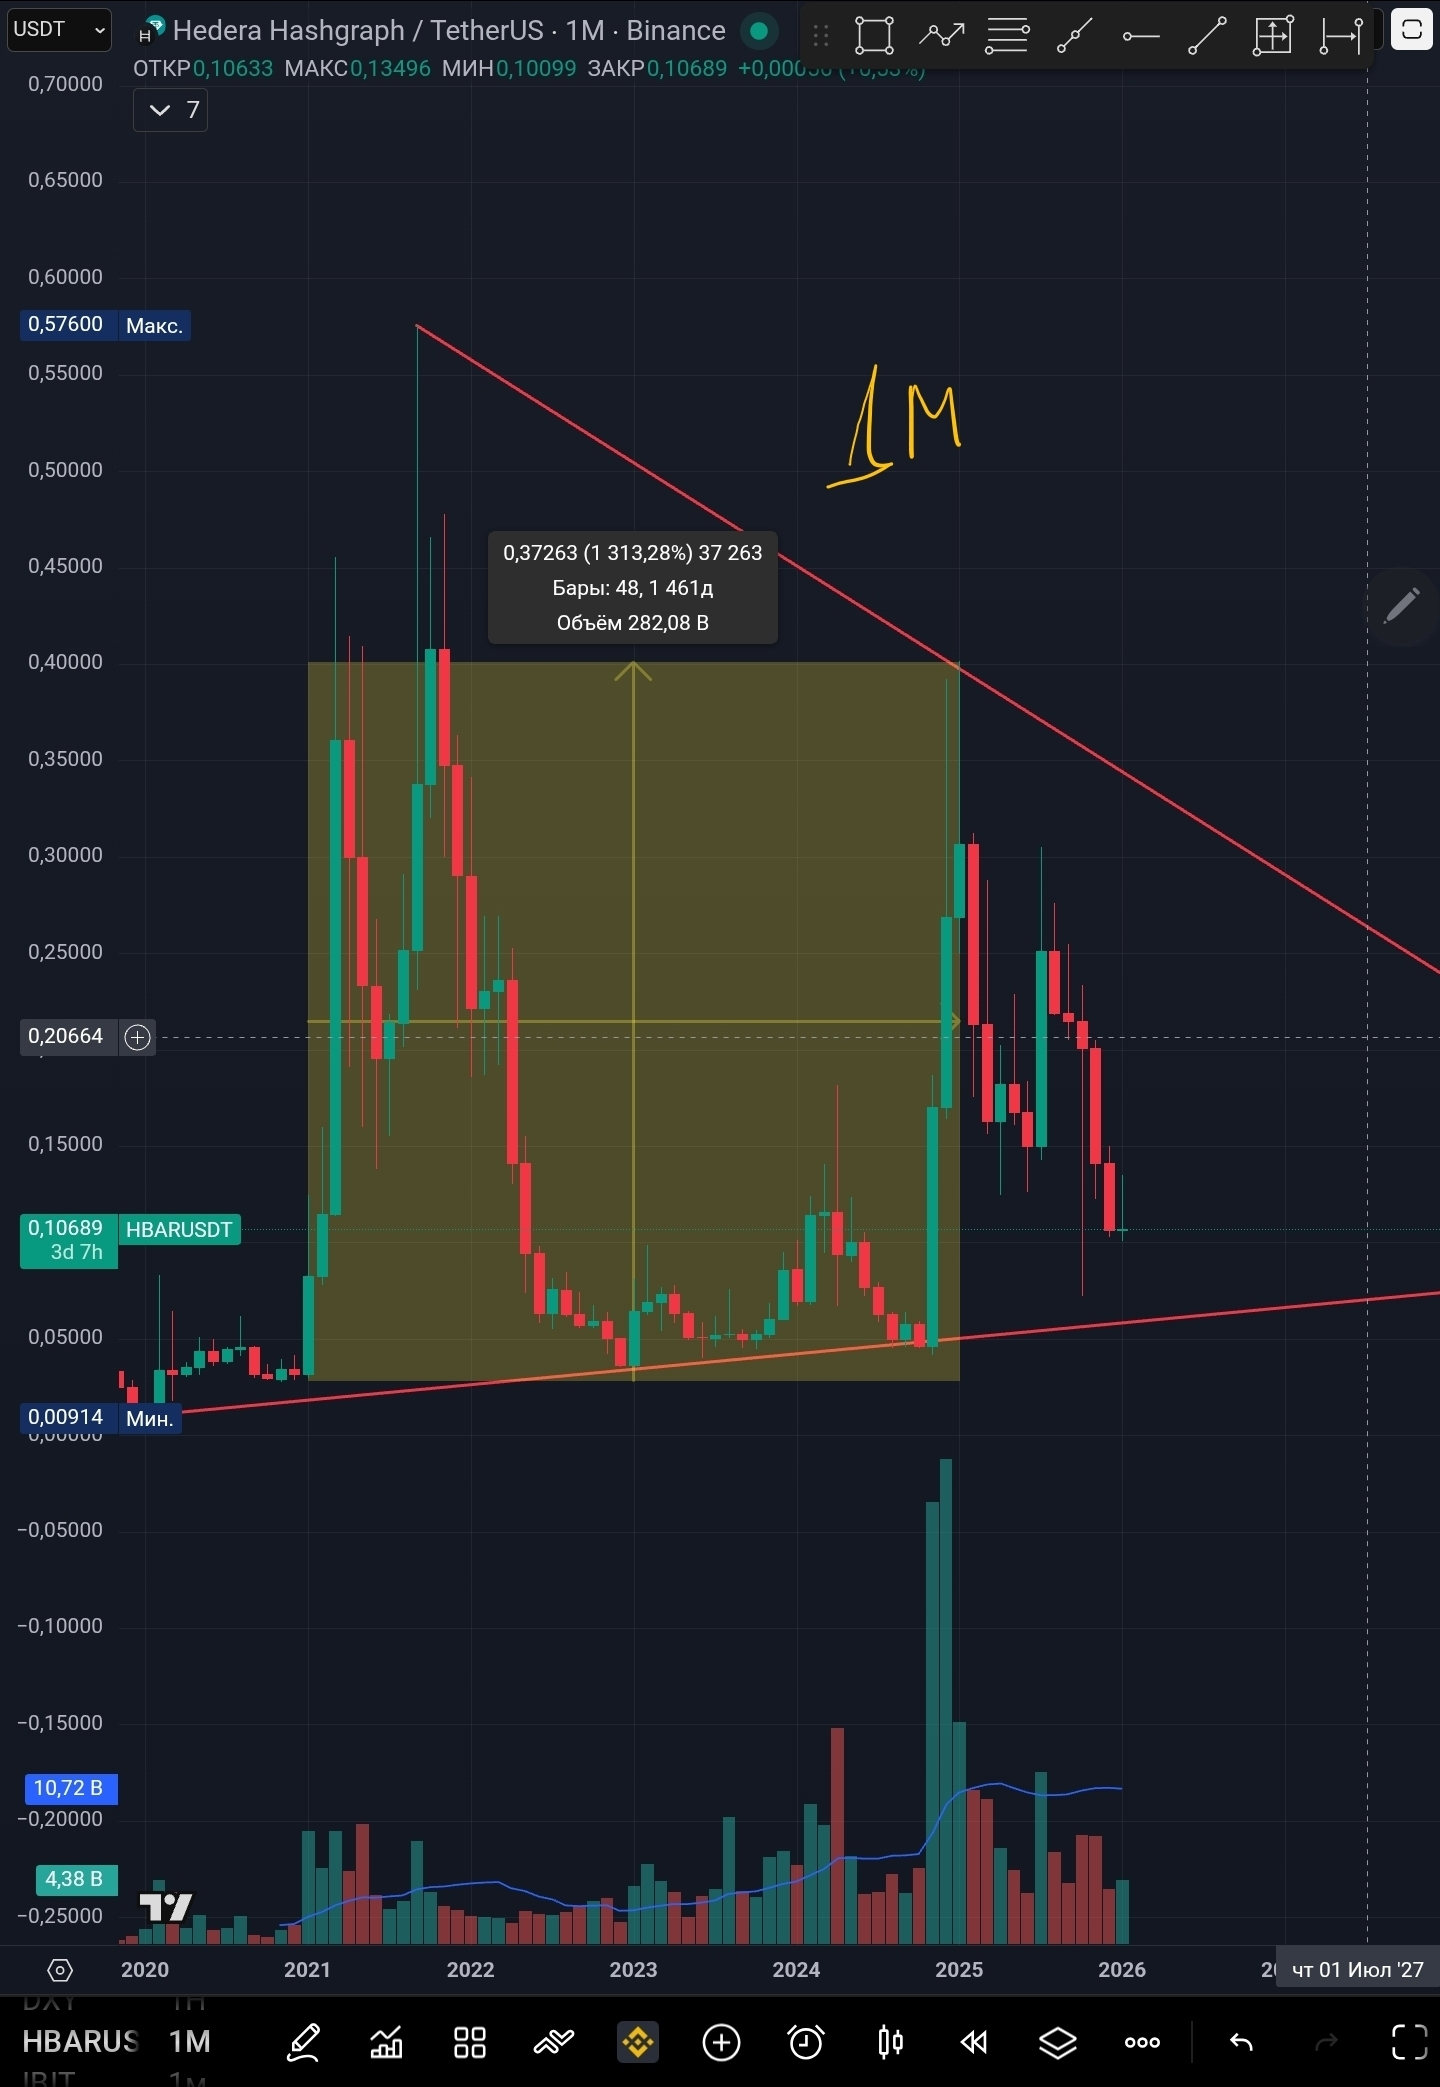
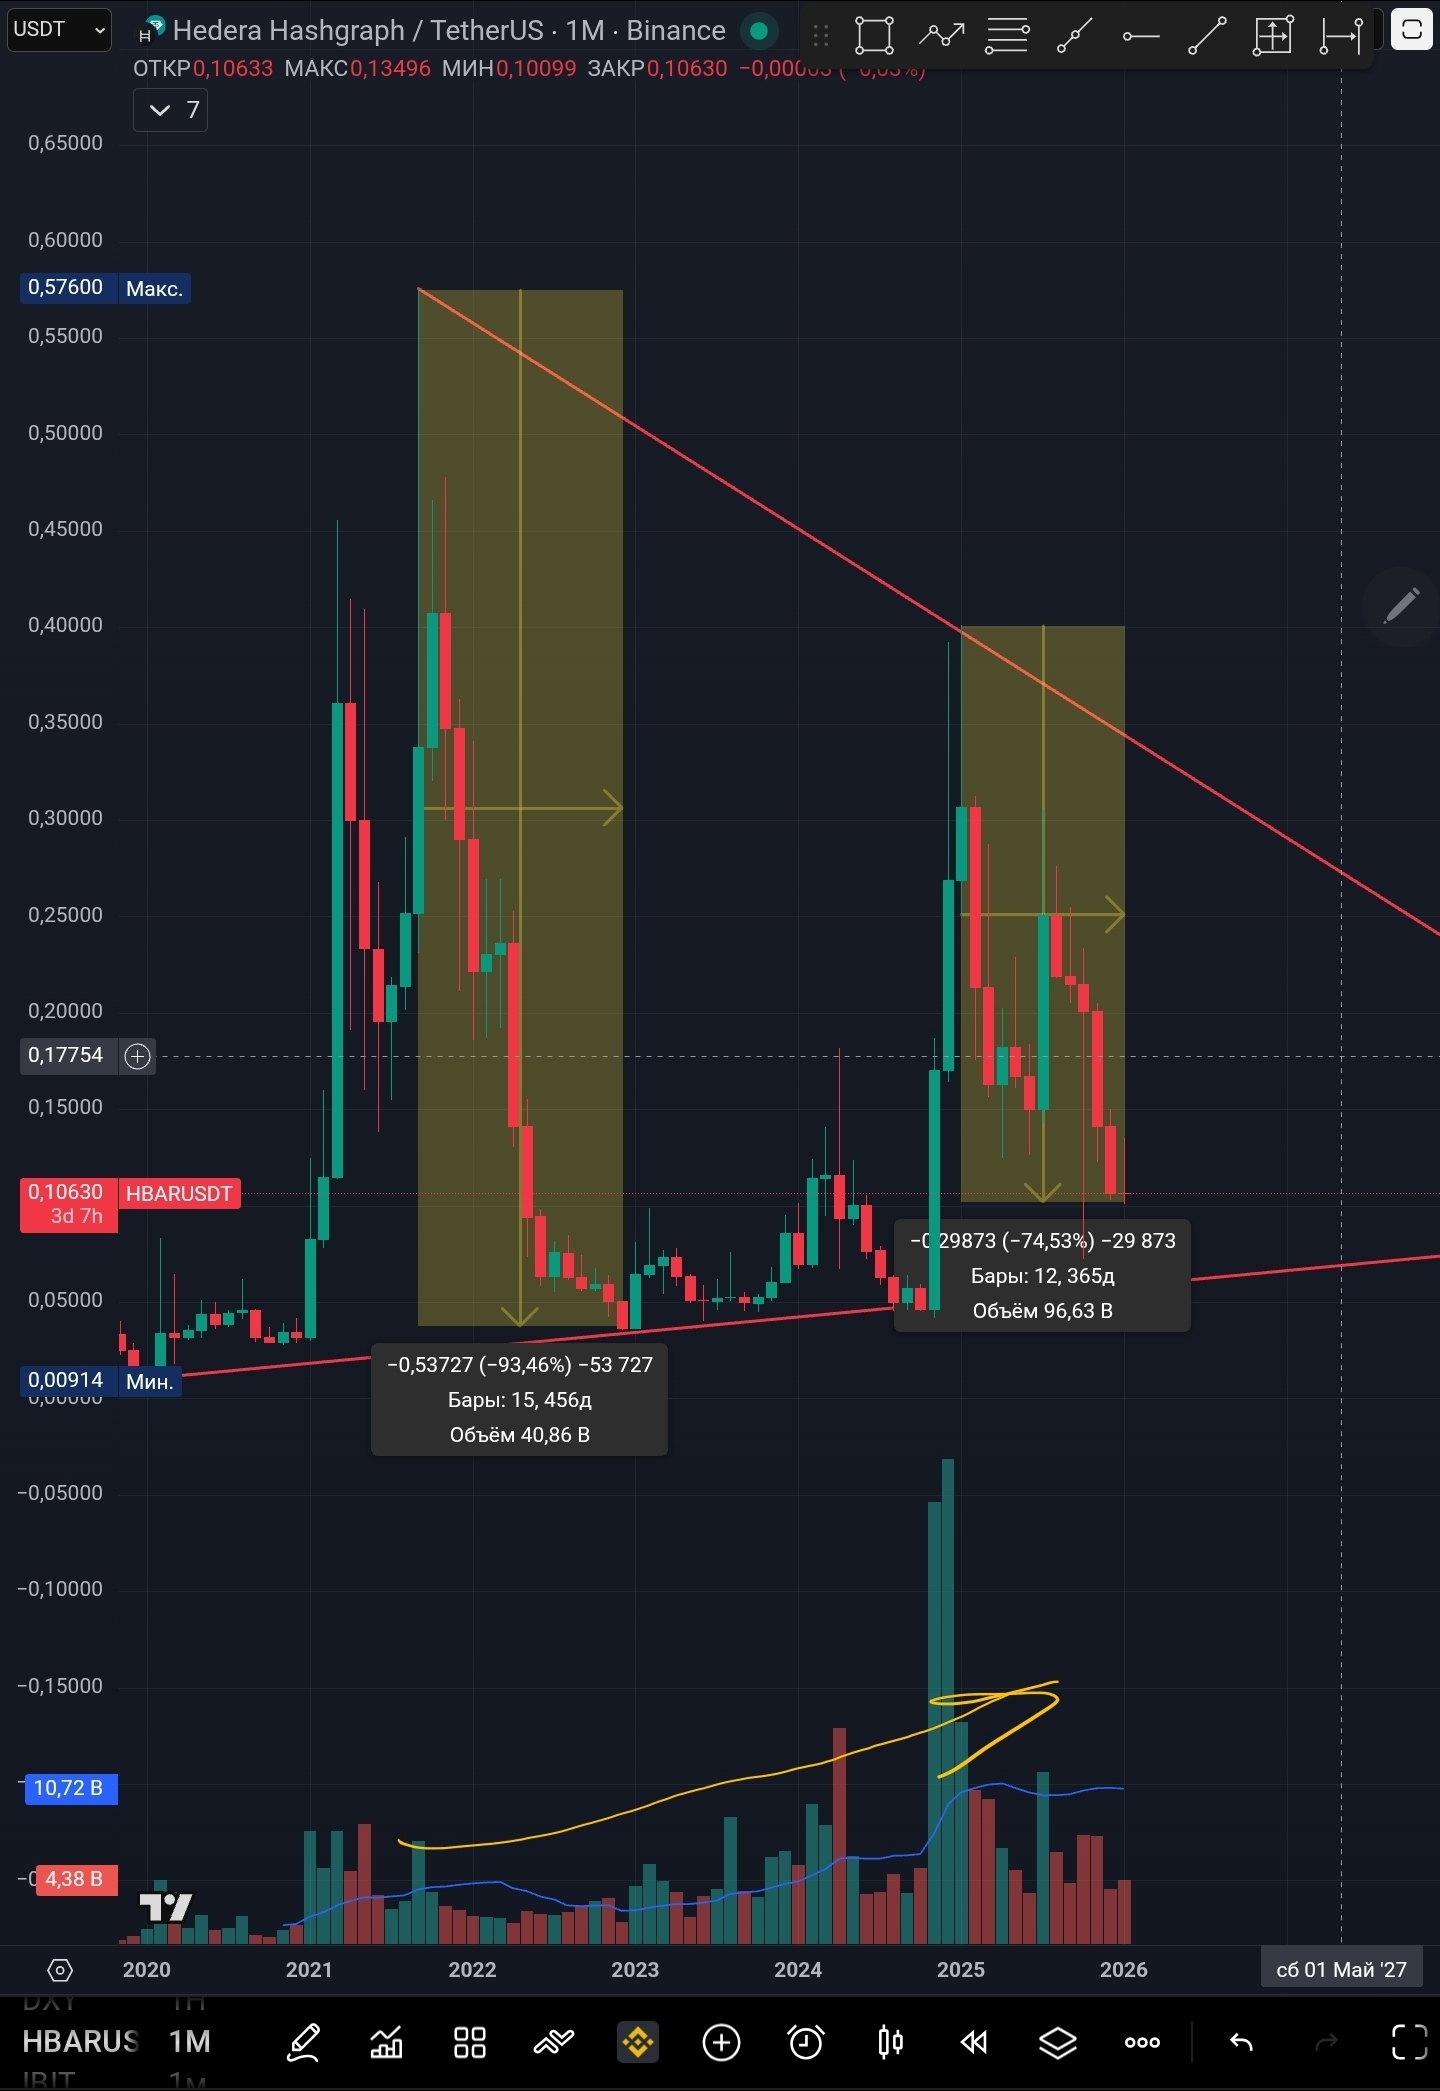
Since the charts remarkably coincide, we can assume that the price will soon reach its local bottom; the past price movement decreased by 93%, while the current decline is 74%. It is also interesting to note that, unlike Bitcoin, the trading volumes of this coin have only been increasing since 2022.
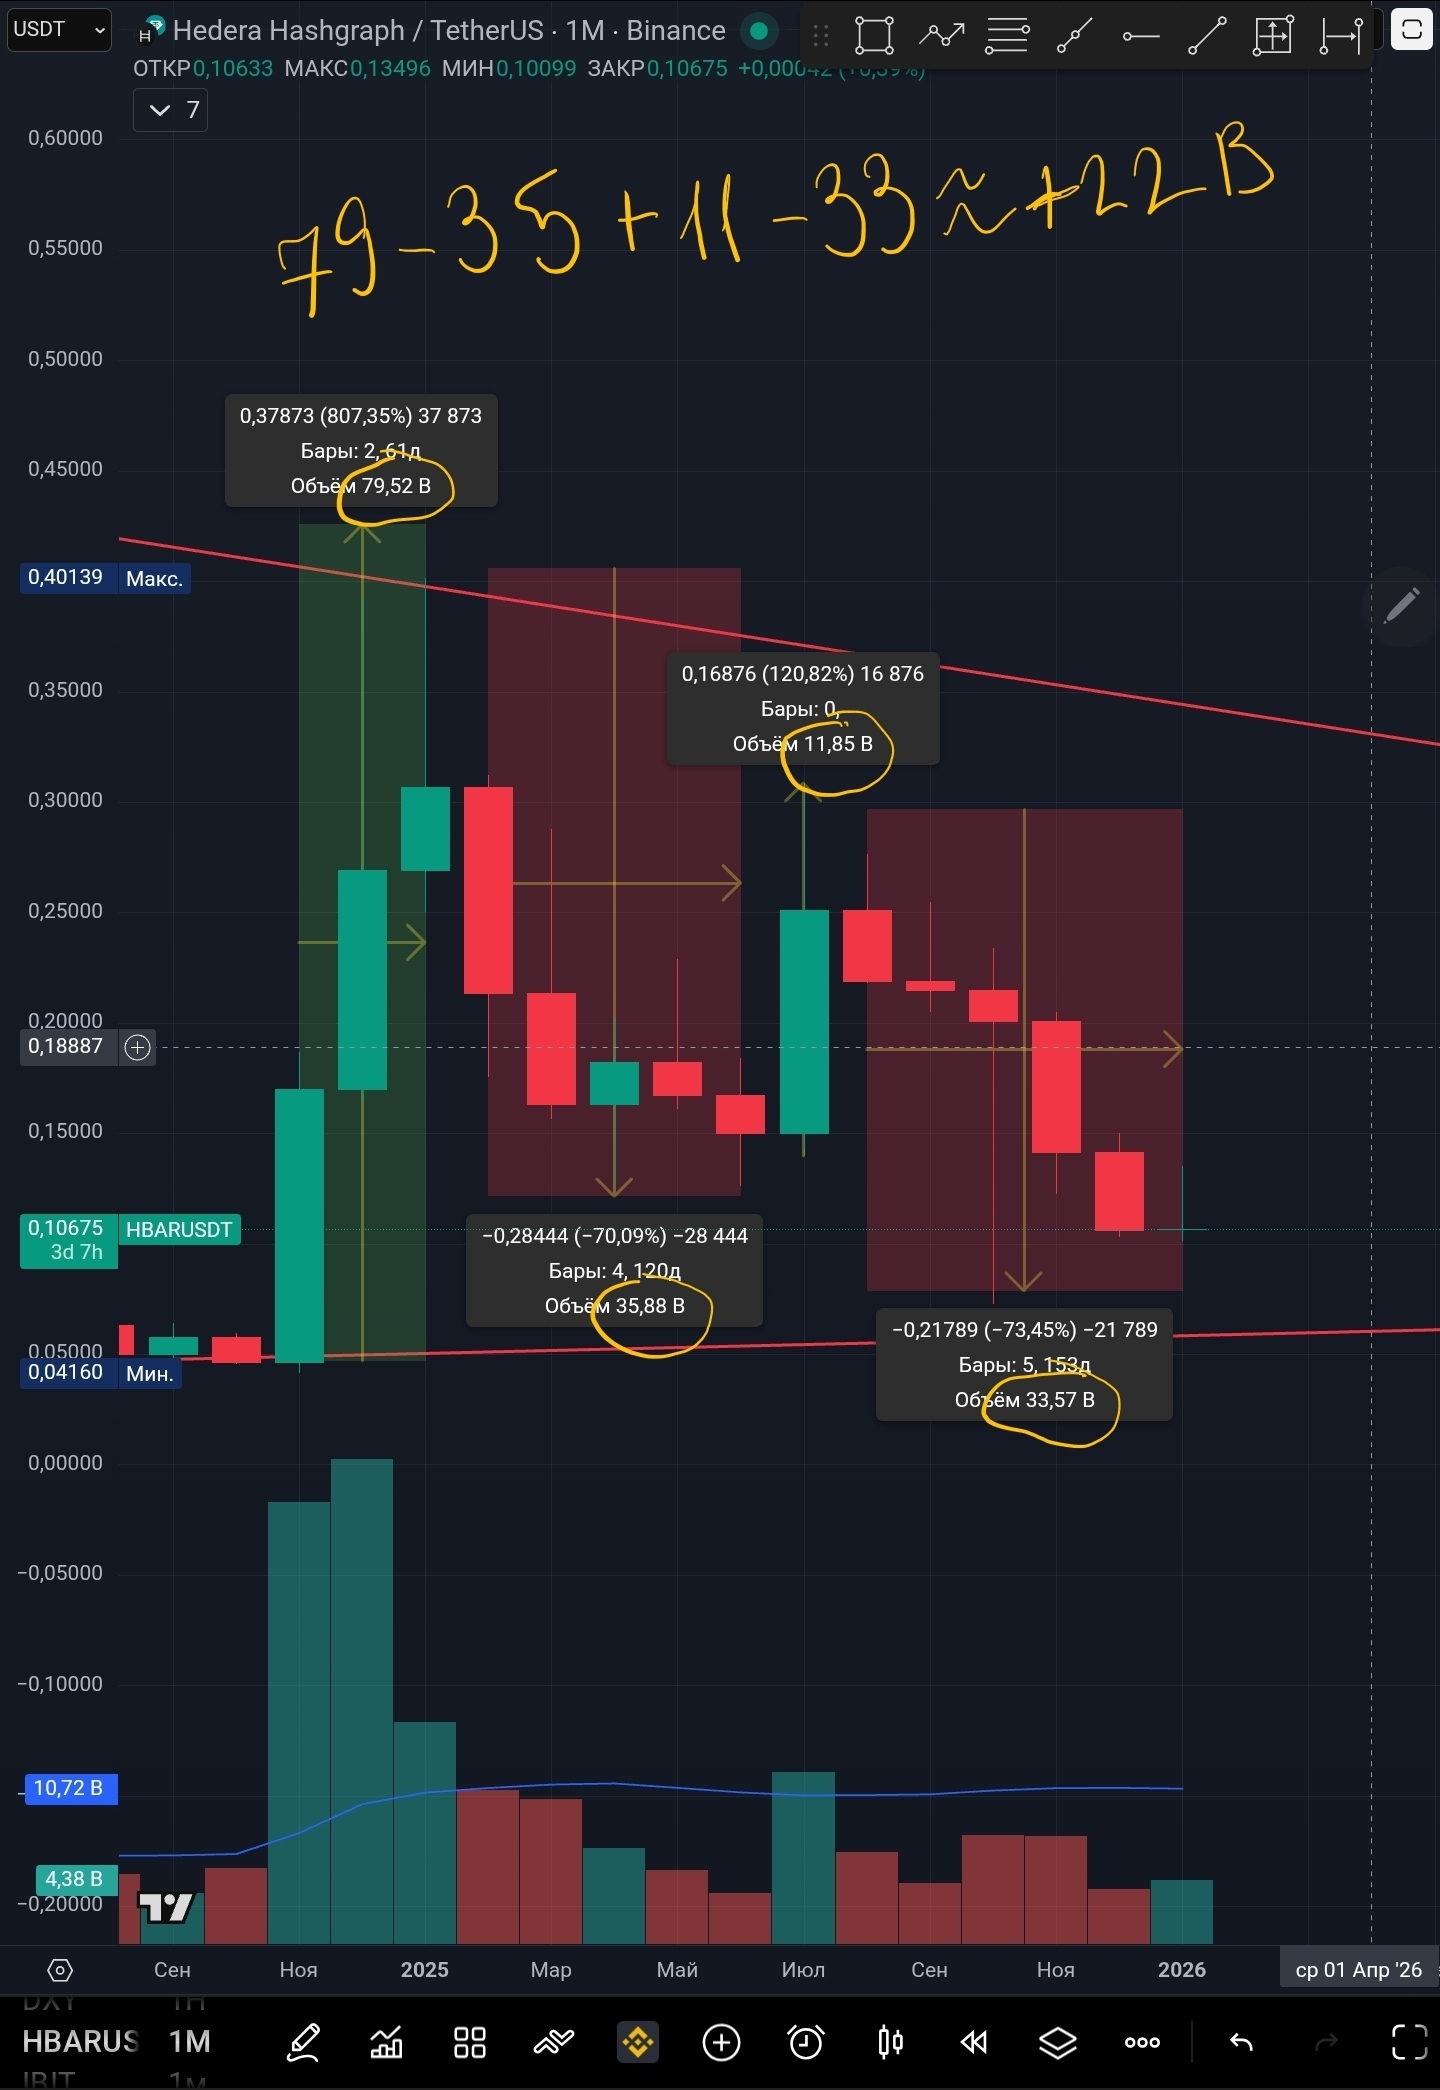
 Approximately 22 billion coins have not been sold since the last major trades; I assume that after the last sell-off, a new cycle will begin.
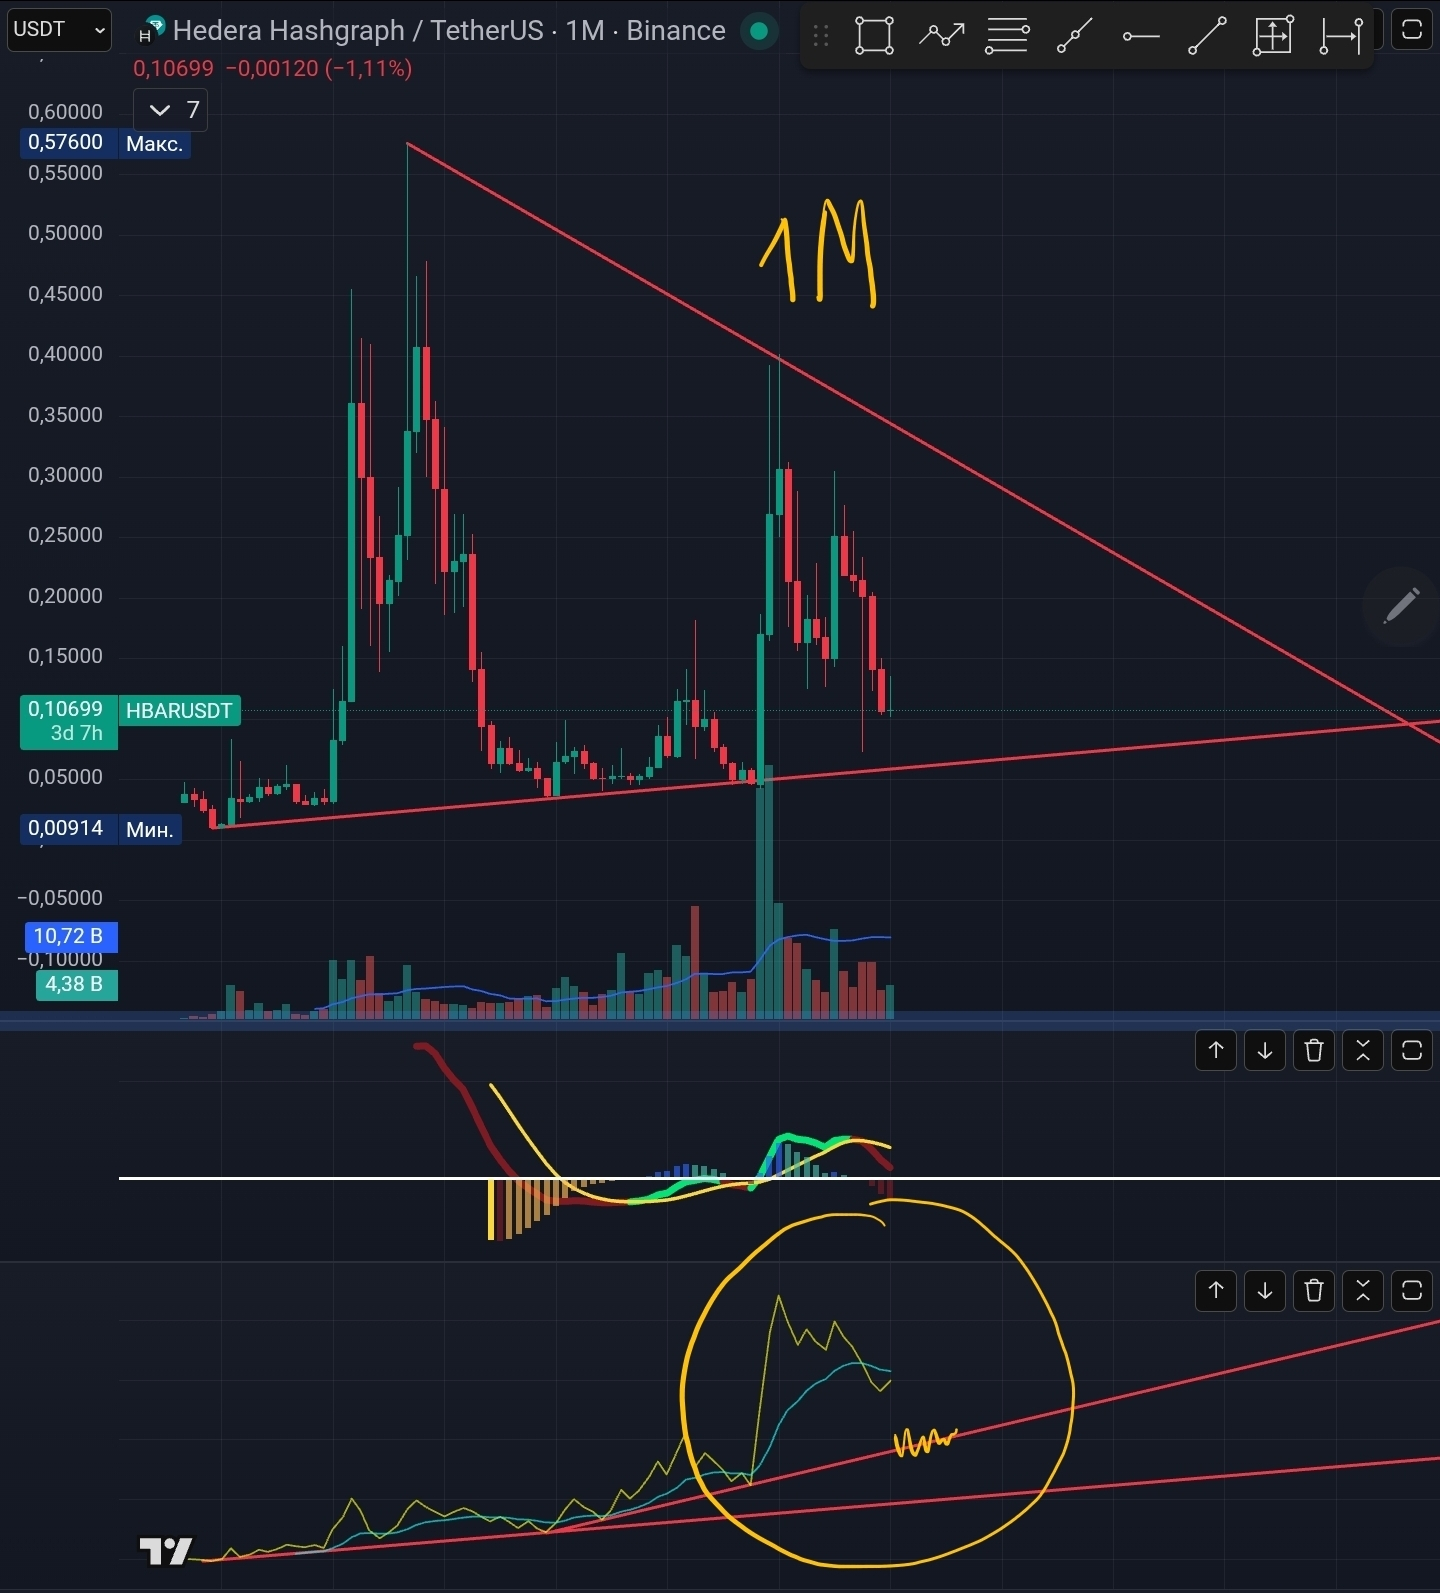
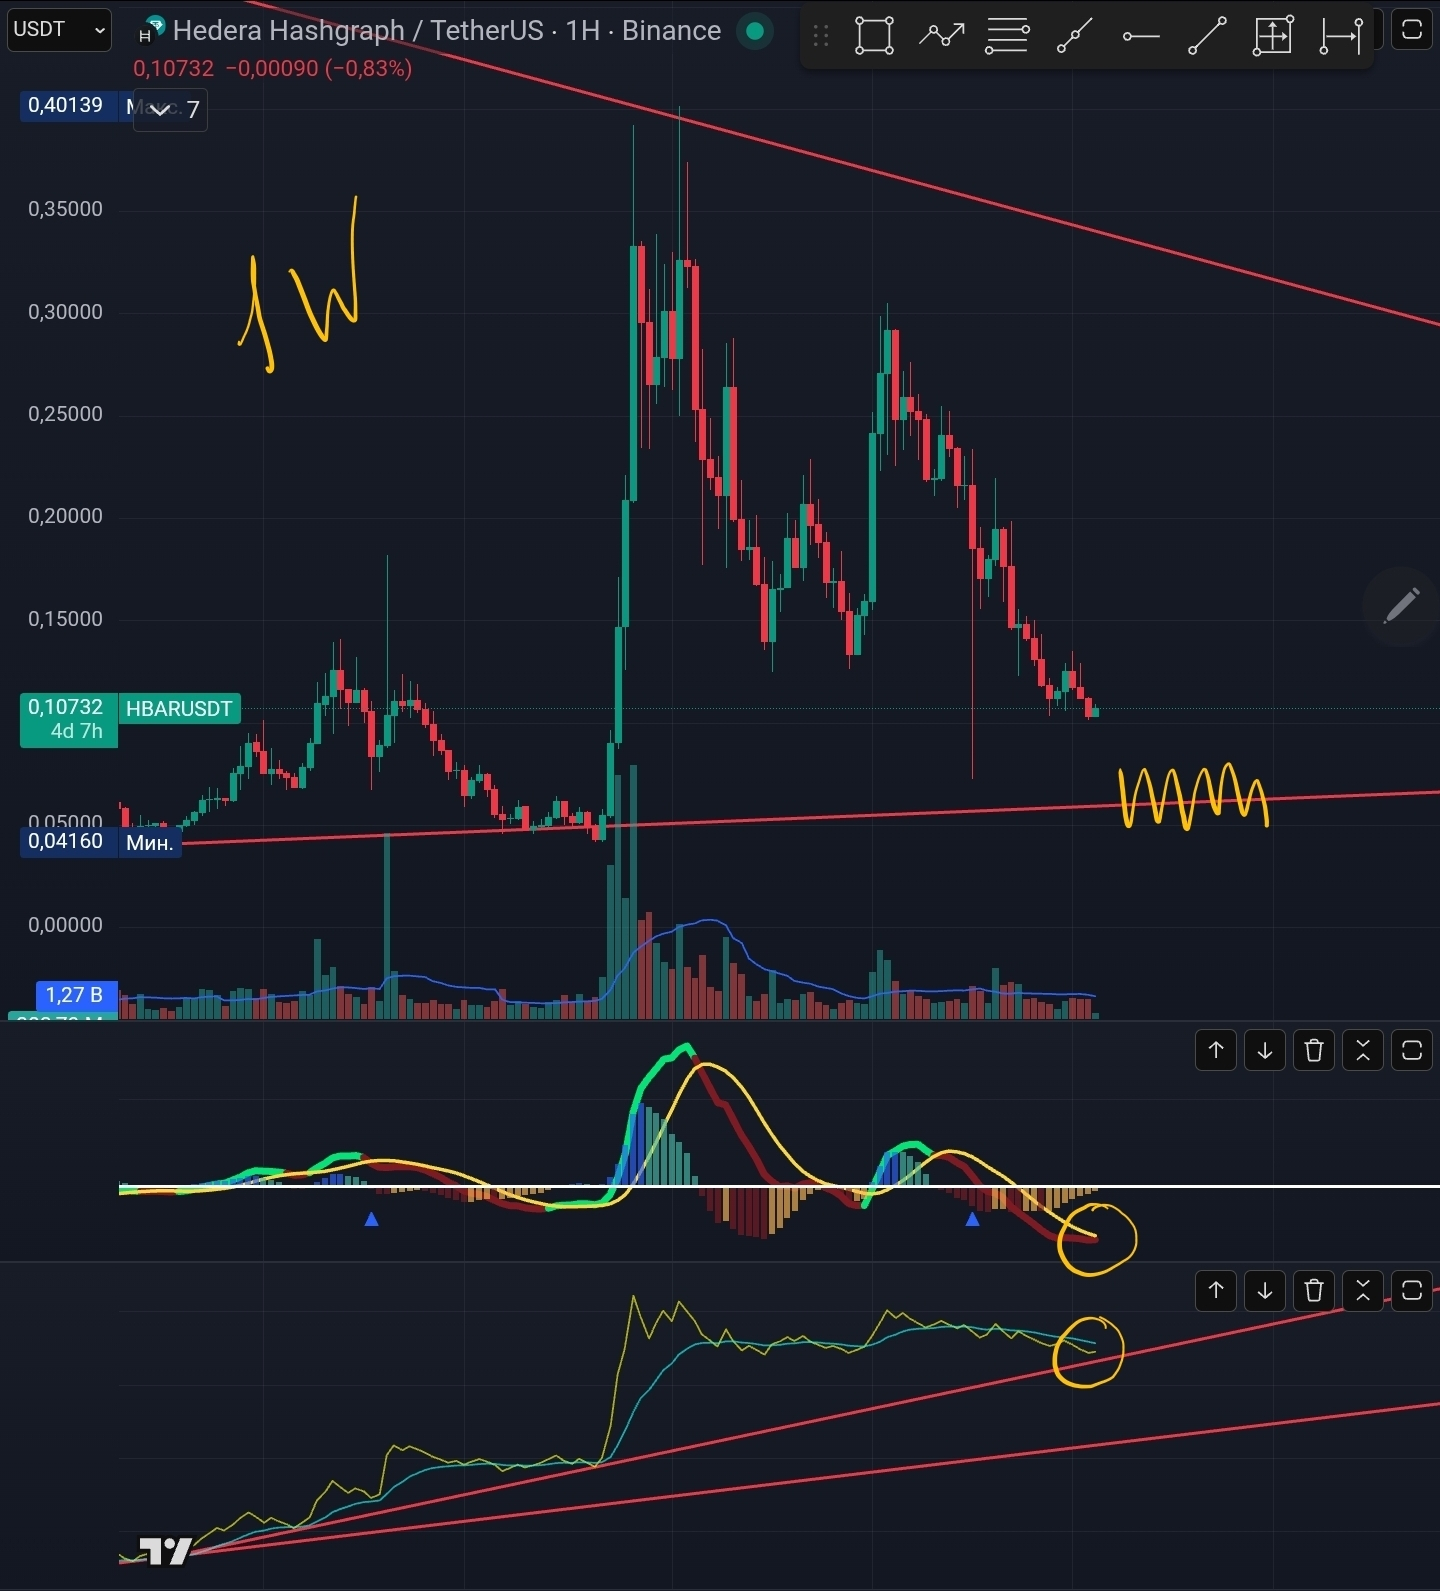
The balance volume indicator shows us that the coin has room to decrease.
On weekly candles, we see that the decline is slowing down; money senses the price approaching the support line. We can observe low volumes, which may indicate that bears are no longer selling at this price, but bulls are still not buying.
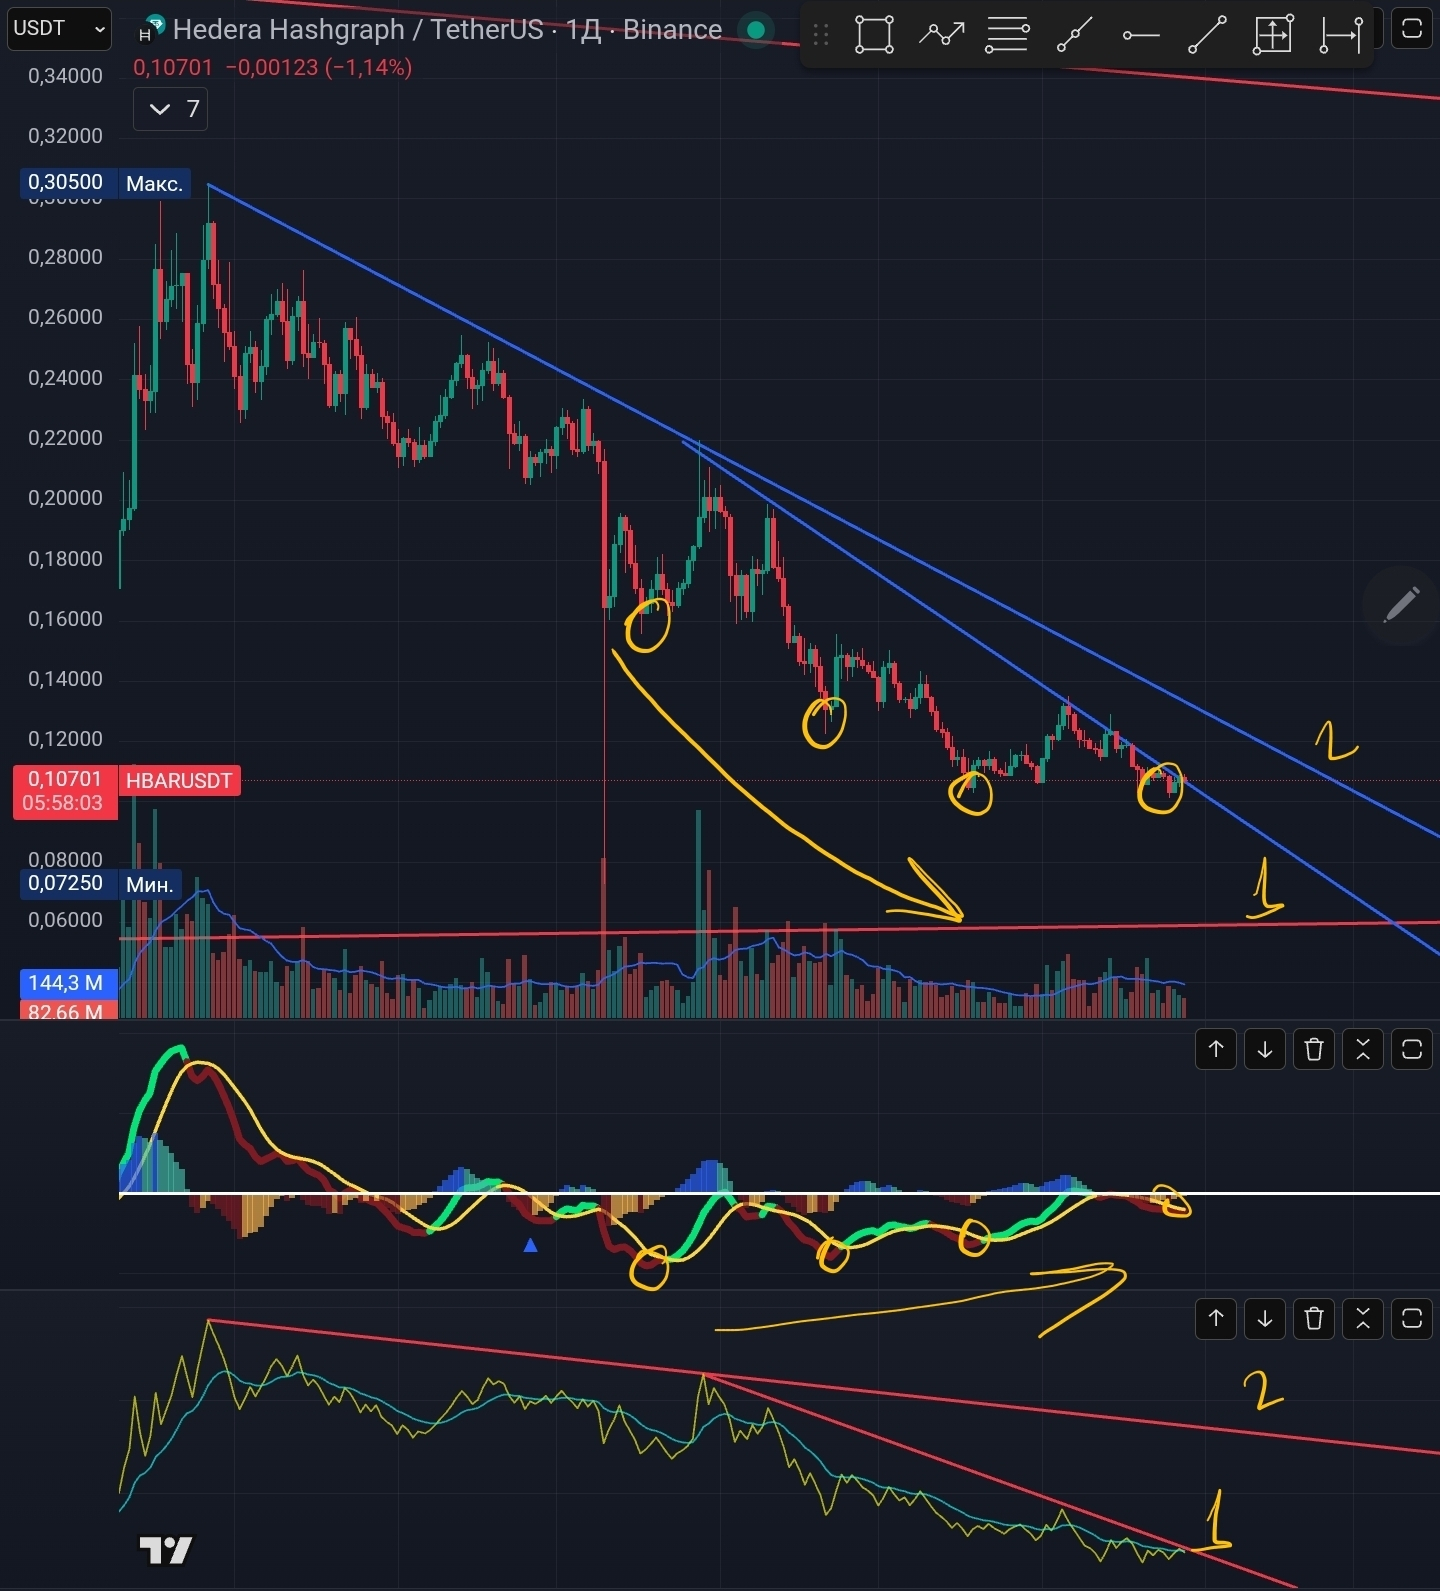
Only on daily charts are reversal trends beginning to show. MACD signals a bullish divergence, but the balance volume indicator tells us that we are only approaching the local descending trend line 1, but we still cannot break it, and only breaking the descending trend line 2 will give us a signal that an upward movement is possible.
📍The conclusion I draw for myself is the following: the coin behaves predictably at first glance, !BUT ONLY FOR NOW!. When everyone starts drawing the same lines, looking at the same indicators, just as I do, comparing past movements with future movements, expectations may not align with reality, as many new factors will be introduced into the future, based on a history that did not exist before. Personally, I would have a small capital in this coin and only rely on the hope that one day it will shoot up by itself; or if I had connections with insider information about this coin.
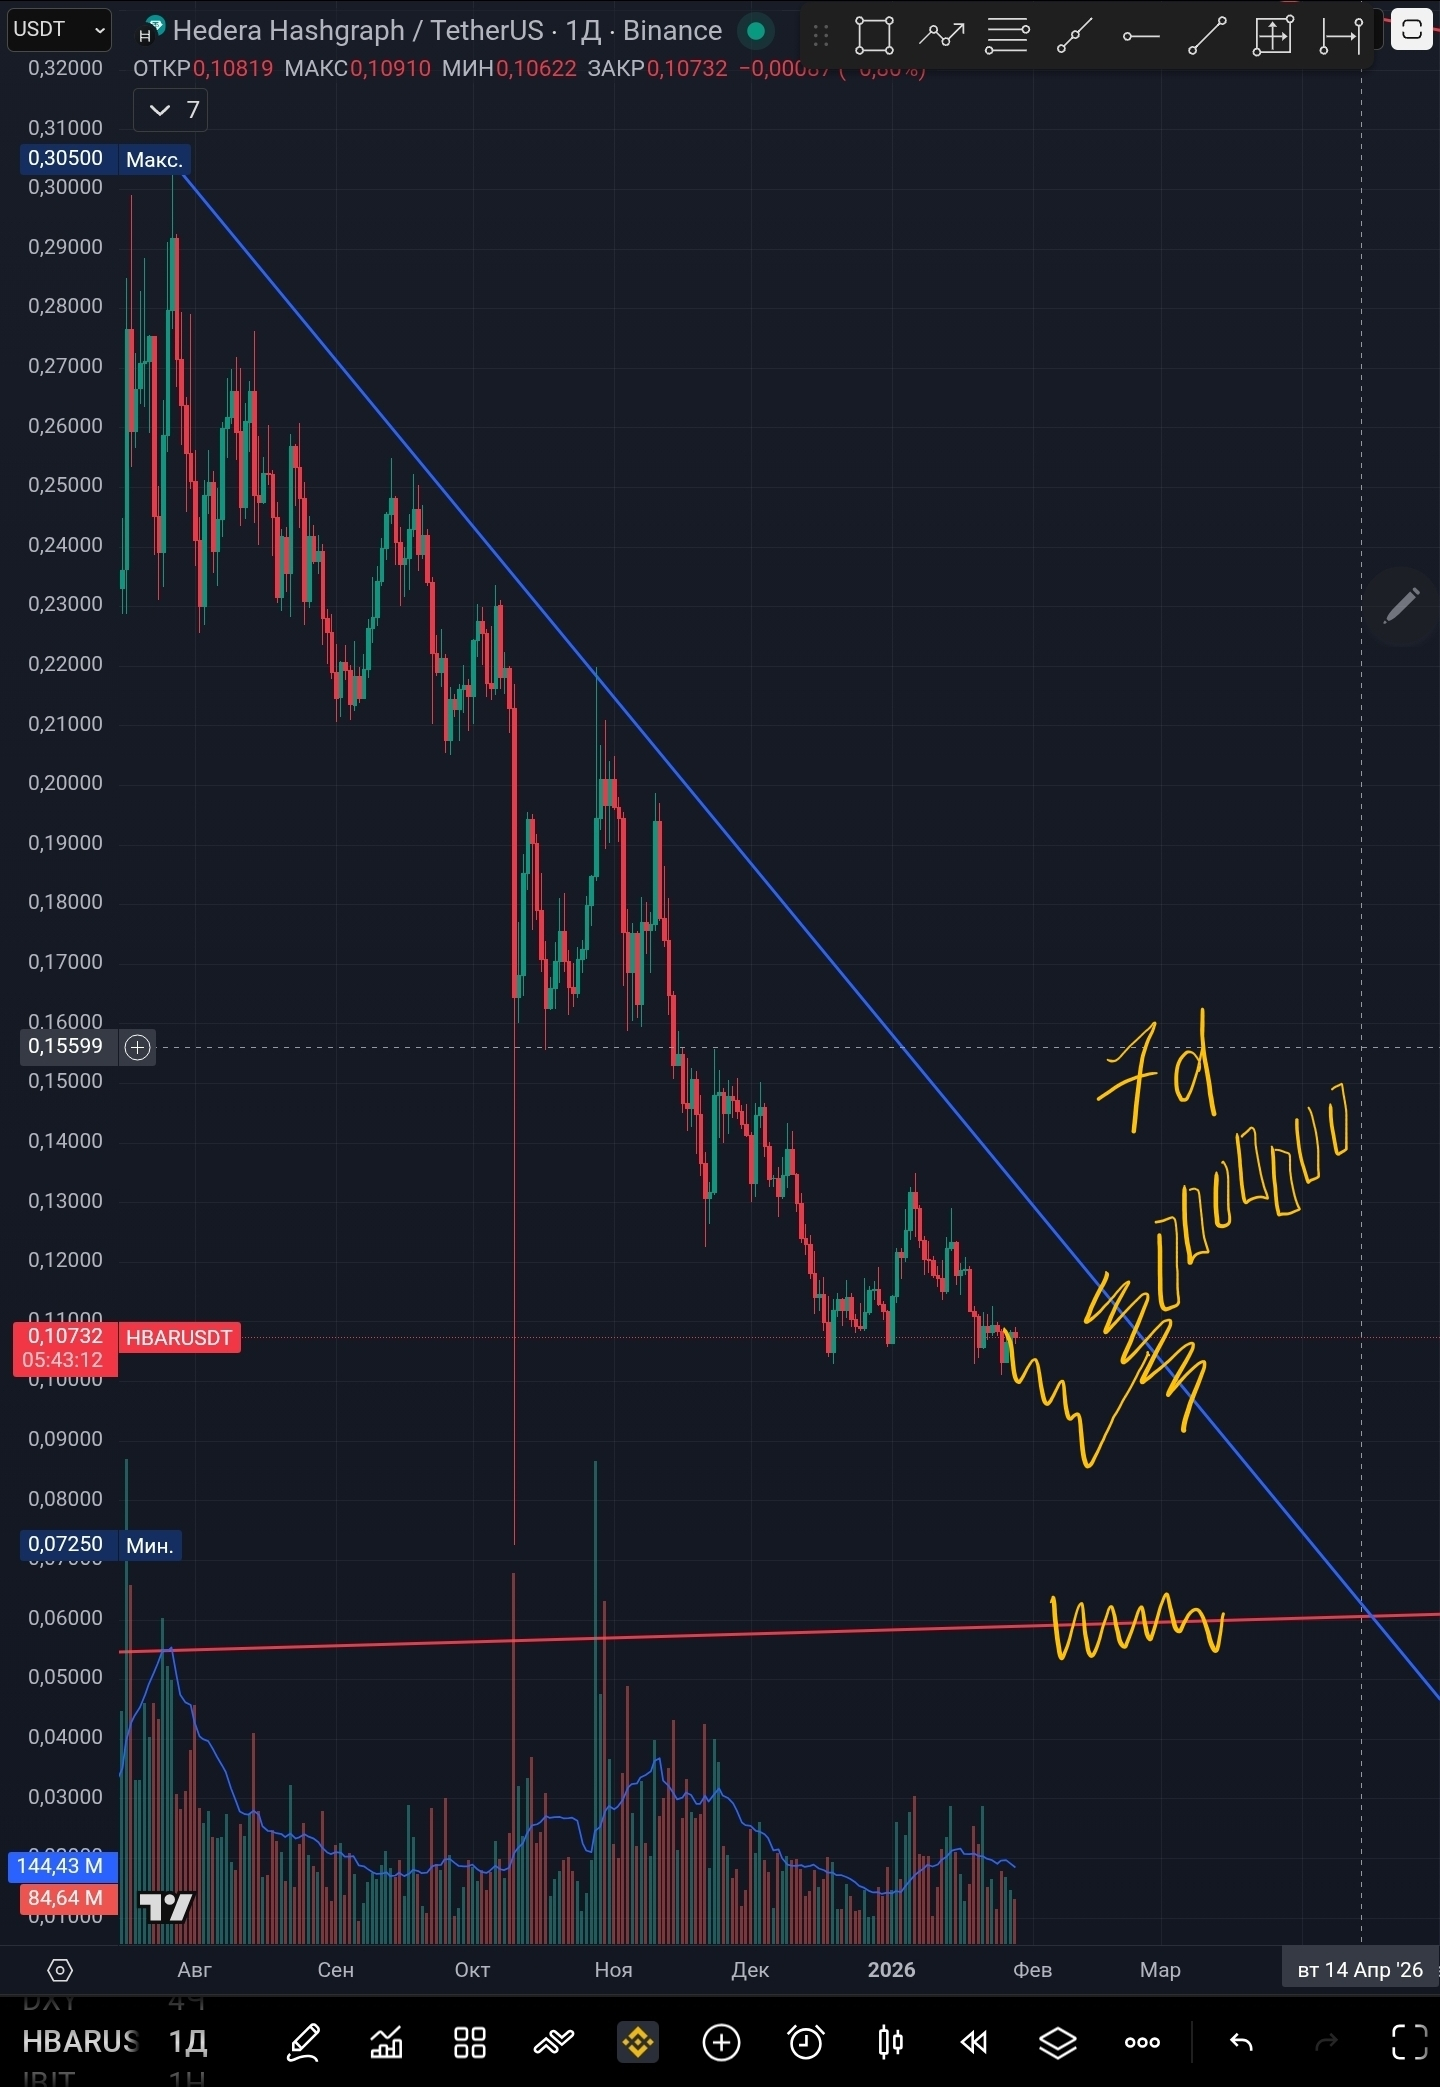
Based on the technical analysis of this chart, the only thing I can say is to enter a trade ONLY AFTER breaking the descending trend line and securing the price above this line for at least seven daily candles. Ideally, the price should test the red resistance line.
✨✨✨
Crypto brothers, are there any holders of this coin among you? What do you think about it? It will be interesting to read your opinion🙌
