Why did PIPPIN suddenly plunge?
If you have been paying attention to meme coins recently, PIPPIN's performance over the past two days is likely to raise eyebrows.
In the past 24 hours,#Pippin the price has plummeted over 13%, and when looking back at this month, the cumulative decline has approached 36%. In contrast, the overall cryptocurrency market has basically remained in a sideways fluctuation during this period, and PIPPIN's performance has clearly underperformed the market.
This is not just a simple intraday fluctuation, but more like a continuation of a deep adjustment.

Both technical analysis and on-chain data are 'saying the same thing'
From a technical structure perspective, PIPPIN has shown clear signs of weakening.
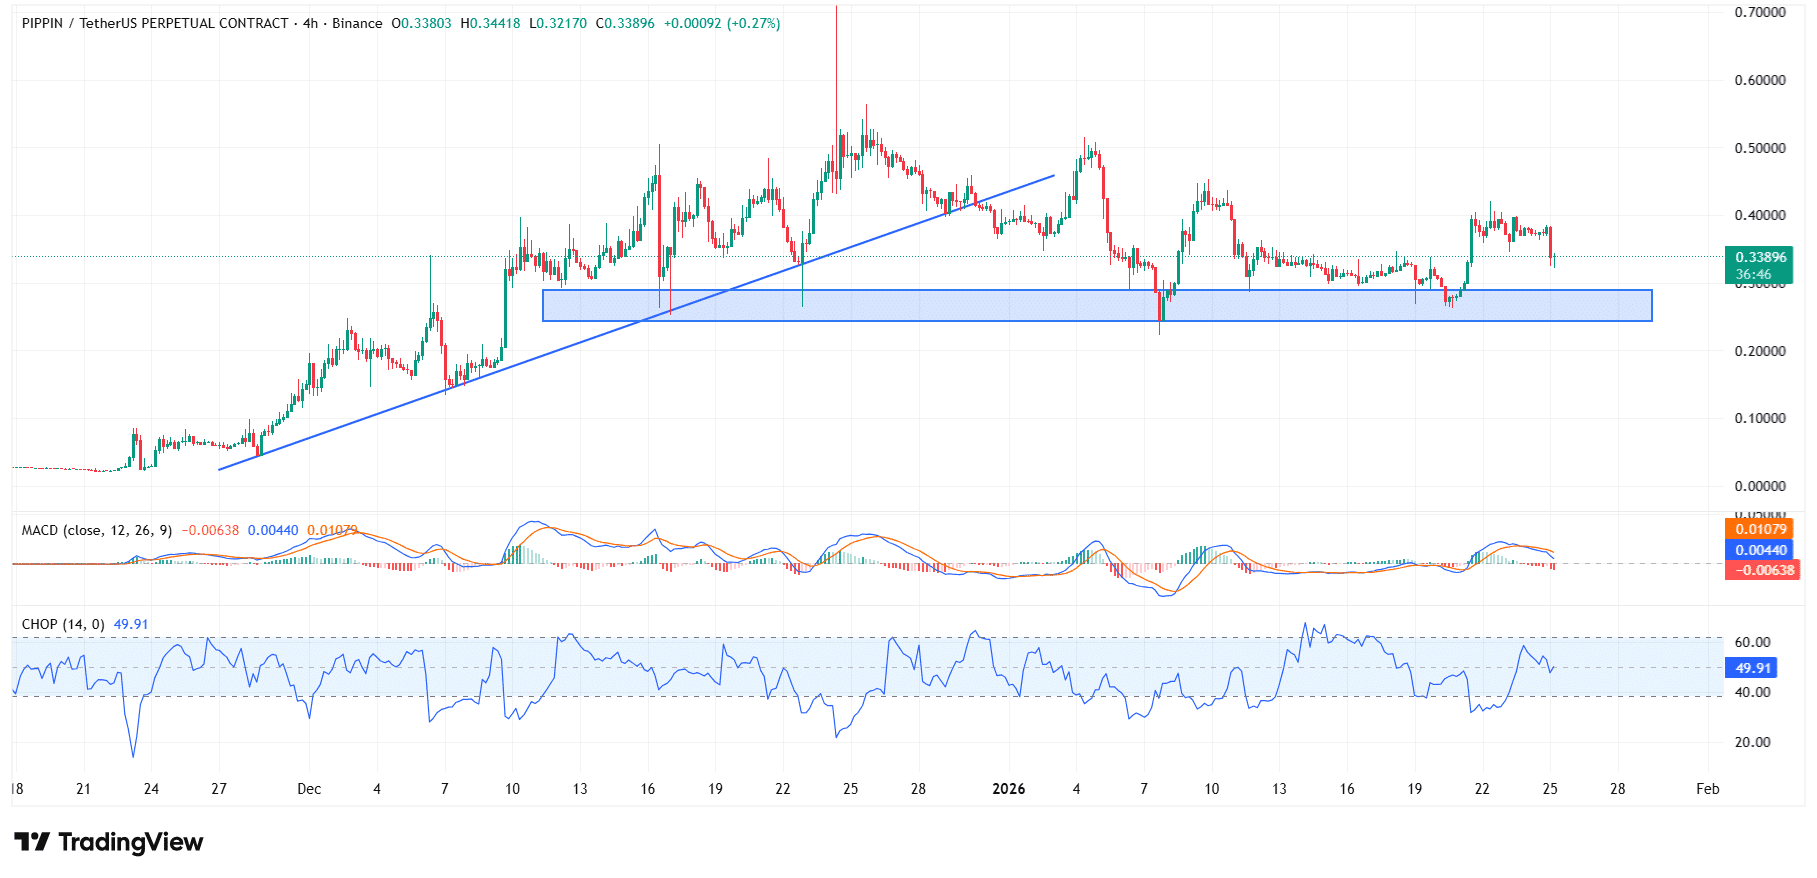
The price peaked near $0.70 and has since fallen back, now breaking below the upward trend line, with the overall structure turning downward.
During this period, although there were several small rebounds after mid-December, the magnitude was not large, and it never broke through the key consolidation range, but rather resembled a breather during the decline.
At the same time, on-chain data also provides quite intuitive feedback.
Smart capital is selling, and selling decisively.
According to StalkChain's statistics, PIPPIN has become one of the most sold tokens in the past 24 hours.
The so-called 'smart capital' has sold PIPPIN worth over $675,000 during this period.
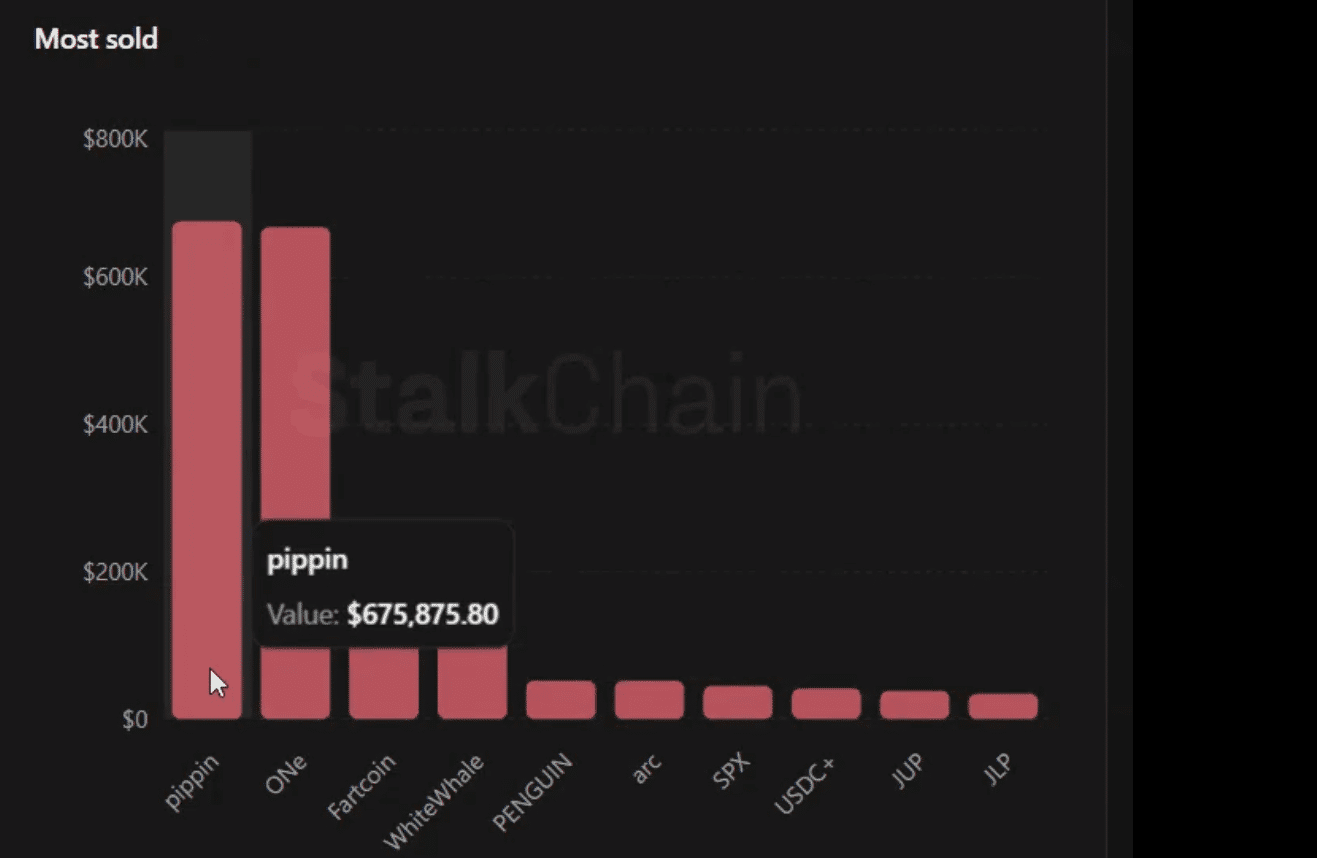
It is worth noting that it is not just PIPPIN being sold off; a clear phenomenon is that:
Similar meme coins like FARTCOIN, WHITEWHALE, and PENGUIN also appear on the sell list, even USDC is included.
This usually means one of two things:
Either locking in profits or stopping losses.
Capital is retreating from high-risk assets.
This round of adjustment is not an isolated event, but rather a synchronized pullback across the entire meme coin sector.
When the market lacks new strong stimuli, traders often choose to withdraw from high-volatility assets and turn to relatively stable targets like Bitcoin and Ethereum.
In other words, PIPPIN's decline is largely a result of capital rotation, rather than a single bearish factor causing a crash.
Volatility has increased, but the direction is still not fully clear.
From the indicators, PIPPIN's current volatility index (CHOP) is around 49, showing that the price is mainly oscillating between $0.28 and $0.50.
Previously, this indicator had approached 60, indicating that the market also lacked a clear trend at that time.
However, it is important to note that selling pressure is gradually increasing.
As the price approaches the support area around $0.29, the red bars in the trading volume have started to expand significantly, indicating that the bears' initiative is increasing.
Will the key support level work again?
Historical trends show that every time PIPPIN tests this support area, there is a rebound to varying degrees.
If this pattern continues, the first potential rebound target may point to around $0.40.
Conversely, if this support is effectively broken, the downward speed is likely to accelerate, and the extent of losses could rapidly increase.
Currently, this situation cannot be concluded completely, as there is still capital in the market betting on a rebound.
The upper 'liquidity magnet' is forming.
According to CoinGlass data, a large number of orders are concentrated around $0.39.
In the range of $0.39–$0.42, there are positions worth thousands of dollars, and this dense distribution often creates an attraction effect on prices.
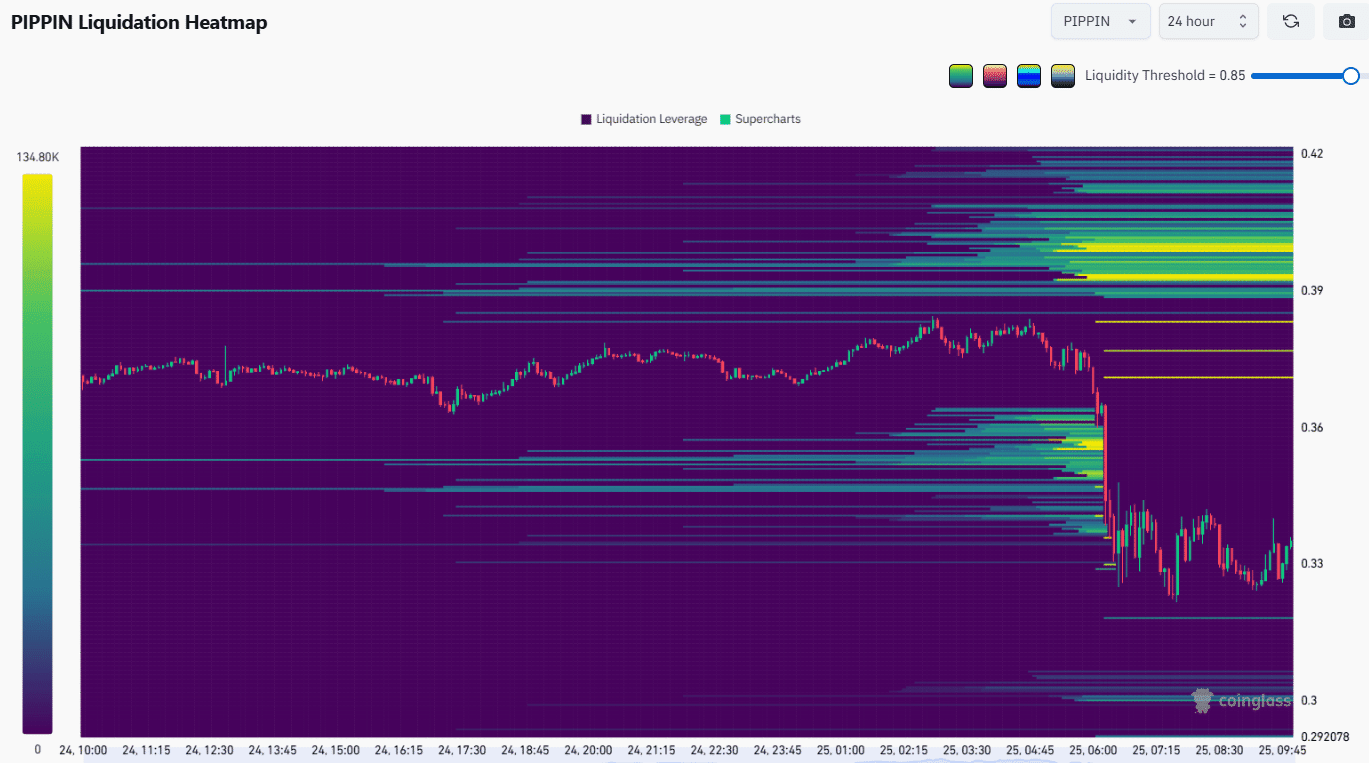
It is important to note that after the price broke below $0.36, a large number of long positions were forcibly liquidated, and the long squeeze accelerated the decline, also laying the groundwork for subsequent rebounds.
Written at the end
A simple summary of the current situation:
PIPPIN has dropped over 13% in the last 24 hours, with the monthly decline expanding to 36%.
Smart capital is concentrated on selling, intensifying short-term pressure.
Funds are flowing from meme coins to more stable assets like BTC and ETH.
The technical aspect is still in a downward structure, but it is approaching historical support areas.
Liquidity around $0.39 may become a short-term rebound target.
Next, the market seems to be waiting for a choice:
It will soon provide an answer as to whether it is a technical rebound or an accelerated decline after breaking support.#美国加密市场法案延迟