What is SuperTrend?
A simple directional indicator that shows you the price direction (up or down) and gives you clear buy and sell signals.
Its common settings (used in the chart):
• Period = 10
• Multiplier = 3
How does it work simply?
1. It calculates only one line.
2. In an uptrend → the line is below the price (usually green) → acts as support.
3. In a downtrend → the line is above the price (usually red) → acts as resistance.
4. When the price crosses above the line → Buy signal (upward trend begins).
5. When the price crosses below the line → Sell signal (downward trend begins).
The practical way to use it (very easy):
For buying (Long):
• Wait until the price closes above the SuperTrend line.
• Set the stop loss just below the line.
• You can use the line as a trailing stop (moving the stop with the line upwards).
For selling (Short or exit):
• Wait until the price closes below the SuperTrend line.
• Set the stop loss just above the line.
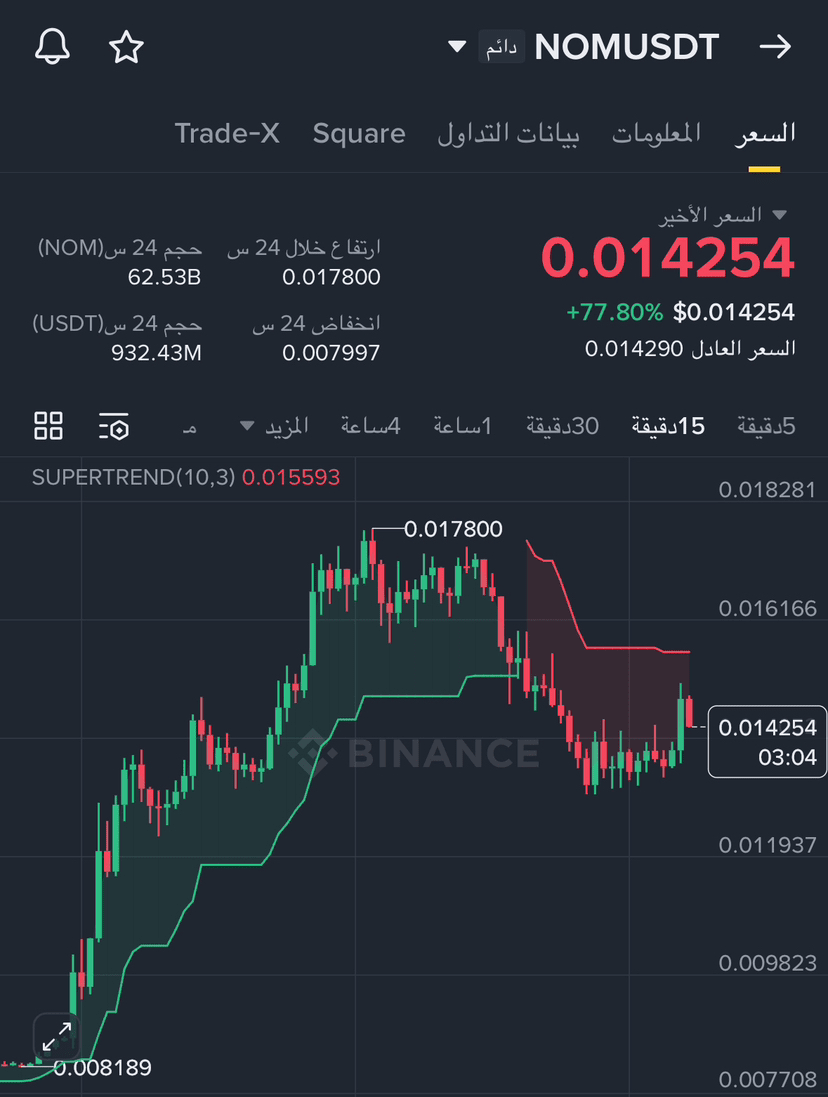
In the current chart (NOMUSDT):
• The trend was strongly upward → the green line is below the price (excellent support).
• A downward reversal has occurred recently: the price dropped sharply from 0.0178 to 0.014254.
• Now the price is below the line (0.014254 < 0.015593) and the line is red → Sell signal / downward trend.
• The current line at 0.015593 acts as strong resistance.
• Current signal: Downward trend – it is preferable to exit long positions or open short positions.
Quick tip for beginners:
• Do not use SuperTrend alone → it is better with support/resistance or moving averages or RSI.
• Best on 15-minute time frames or higher to reduce false signals.
• In sideways markets (non-trending), it gives many false signals → avoid it then.