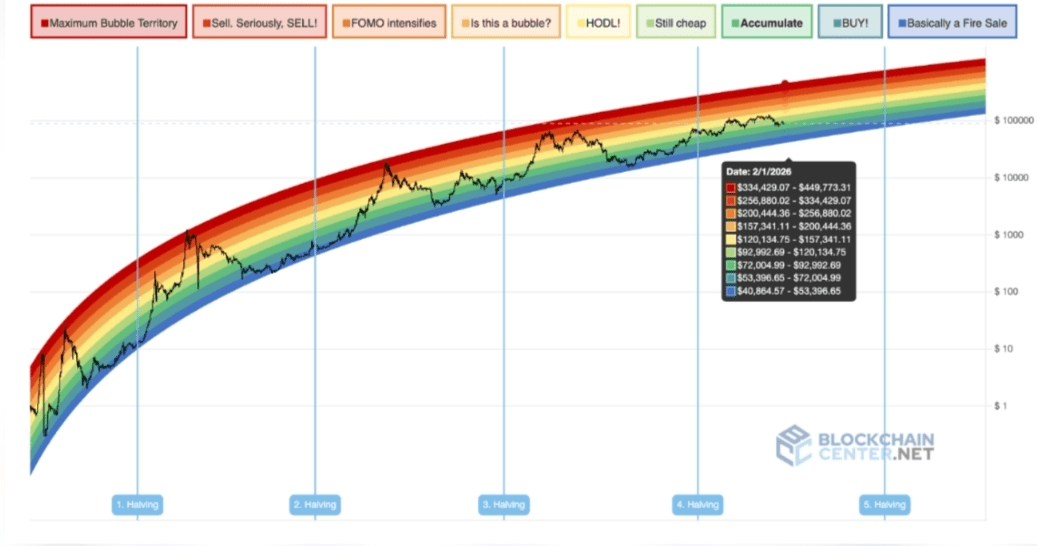
According to the Bitcoin Rainbow Chart, which is based on a logarithmic growth curve focusing on long-term trends rather than daily market fluctuations, the following price predictions for Bitcoin are expected at the beginning of February 2026:
Basically a Fire Sale (Sharp Discount): $40,864 – $53,396
BUY! (Strong Buy): $53,397 – $72,005
Accumulate (Gradual Accumulation): $72,005 – $92,993
Still cheap (Still cheap): $92,993 – $120,135
HODL! (Hold On for Dear Life): $120,135 – $157,341
Is this a bubble? (Is it a bubble?): $157,341 – $200,444
FOMO intensifies (Fear of Missing Out): $200,444 – $256,880
Sell. Seriously, SELL! (Urgent Sale!): $256,880 – $334,429
Maximum Bubble Territory: $334,429 – $449,773
📌 Current Price Level
As of January 24, Bitcoin is trading around $89,300, near the end of the Accumulate range. If the long-term trend continues without entering a phase of recklessness, the price is expected to move into the Still cheap range, which is between $92,993 – $120,135.
📈 Technical Analysis
The price is slightly below the 50-day average (SMA) at $90,313
Below the 200-day average (SMA) at $105,072, indicating short-term weakness and cooling long-term momentum
14-day Relative Strength Index (RSI) at 42.84, in the neutral zone, indicating decreased selling pressure but without strong upward momentum
💡 Summary: Bitcoin is still close to the accumulation level, and the opportunity to enter is still available before it reaches Still cheap levels.
