
(A Beginner's Guide to Cryptocurrency Trading) Version 2.4 released, grab it for free!
1. Analyzing from the chart
First, look at the chart, this is the weekly line of Bitcoin, the line chart since 2018. (The line chart is drawn based on closing prices, which can reduce some noise for medium to long-term analysis.)
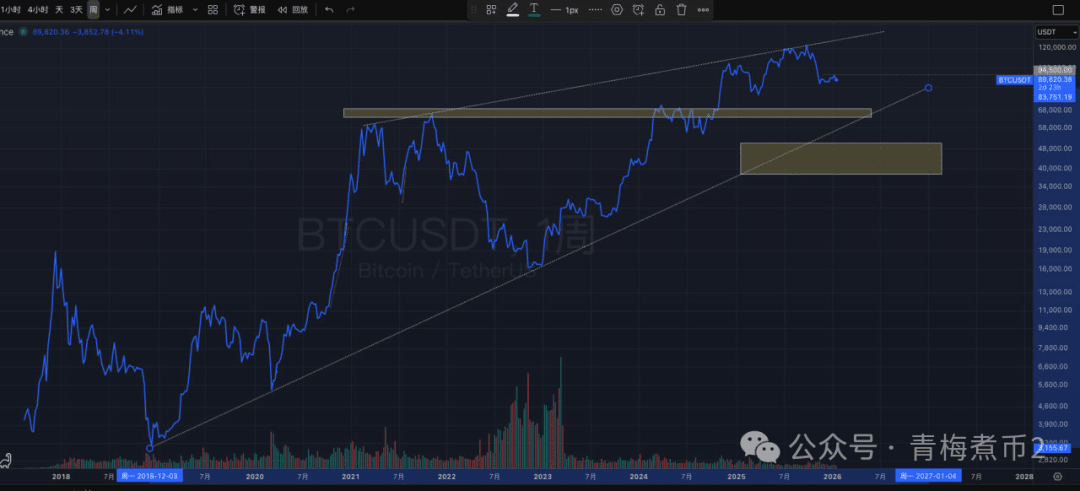
In terms of form, there is a huge upward wedge, and the lower edge of the form is also an upward trend line, which is a structural support and may be the bottom of this round of pullback.
The previous bull market was a double top structure, with the top of the line chart (calculated based on weekly closing prices), the support range formed by the double top is 60000-66000, and according to the candlestick chart, the top is 64800 - 69000.
As time goes by, the support of the wedge lower edge/trend line is moving up, coinciding with the double top support area.
So, overall, the range of 60000 - 69000 is worth paying attention to, as it may form a bottom here.
II. Bitcoin's Integration with US Stocks
In the early years, Bitcoin had no correlation with US stocks, but as a series of US institutions, companies, ETFs, etc. entered the market, the overall trend of correlation between Bitcoin and US stocks is increasing.
The characteristics of US stocks are that the drawdown is usually not extreme, and the drawdown period is often relatively short. Bitcoin may be affected.
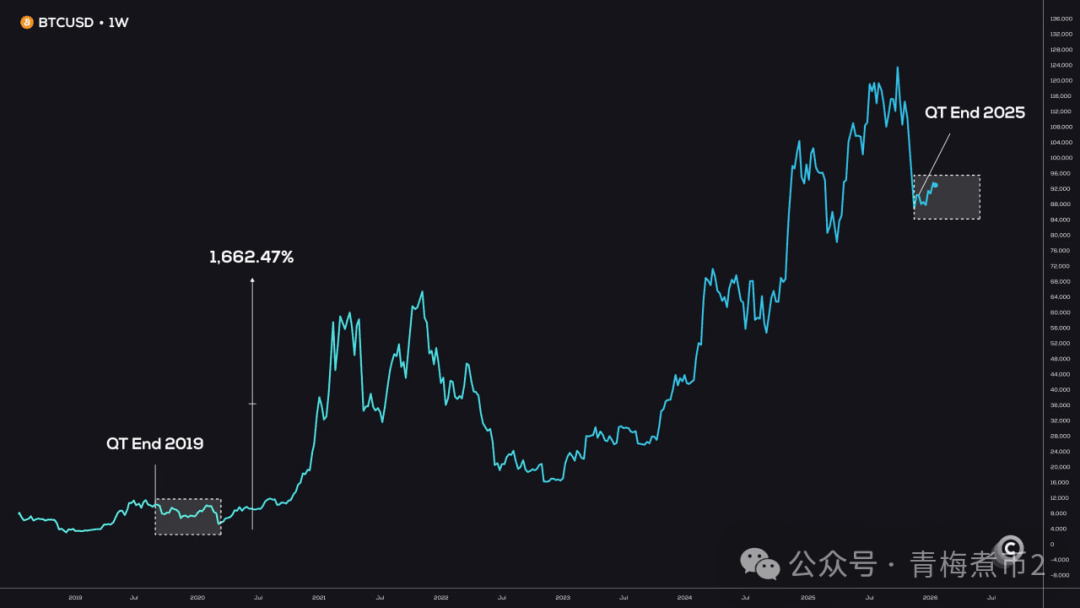
III. The overall environment has shifted to quantitative easing
The relationship between Bitcoin and macroeconomic policies: After the shift from quantitative tightening (QT) to quantitative easing (QE), Bitcoin did not immediately rise, but rather experienced several months of volatility before reversing upward, just like in 2019.
(A Guide to Cryptocurrency Trading for Ordinary People) Version 2.4 has been released!
