Currently $RIVER has deviated from the conventional technical trend category and has evolved into an extremely brutal 'emotional outburst' and 'capital hunting'.
$RIVER The previous trend was relatively flat, but the sudden explosive market recently resembles a rapid rise out of nowhere, clearly driven by major funds taking advantage (possibly due to favorable social media or significant project updates) in a devastating 'short squeeze'. The price once touched an astonishing high of $66, this extreme one-sided surge is a reflection of the most insane side of the market.
For the short sellers who unfortunately met their demise in this market, it is not entirely a failure of technical judgment. In the crypto market, when sentiment and liquidity resonate, rational resistance levels often become meaningless. This 'black swan' type of extreme surge is the harshest test of the market. Respecting the uncertainty of the market, gather your spirits, the funds are still there, and opportunities await.
The market is currently in a phase of divergence between bulls and bears after a period of extreme euphoria: bulls are cheering for "value discovery," while funds that missed out or are now trapped are anxiously searching for direction.
2. Technical Analysis
1. Daily chart: The "Candle of God" that defies gravity.
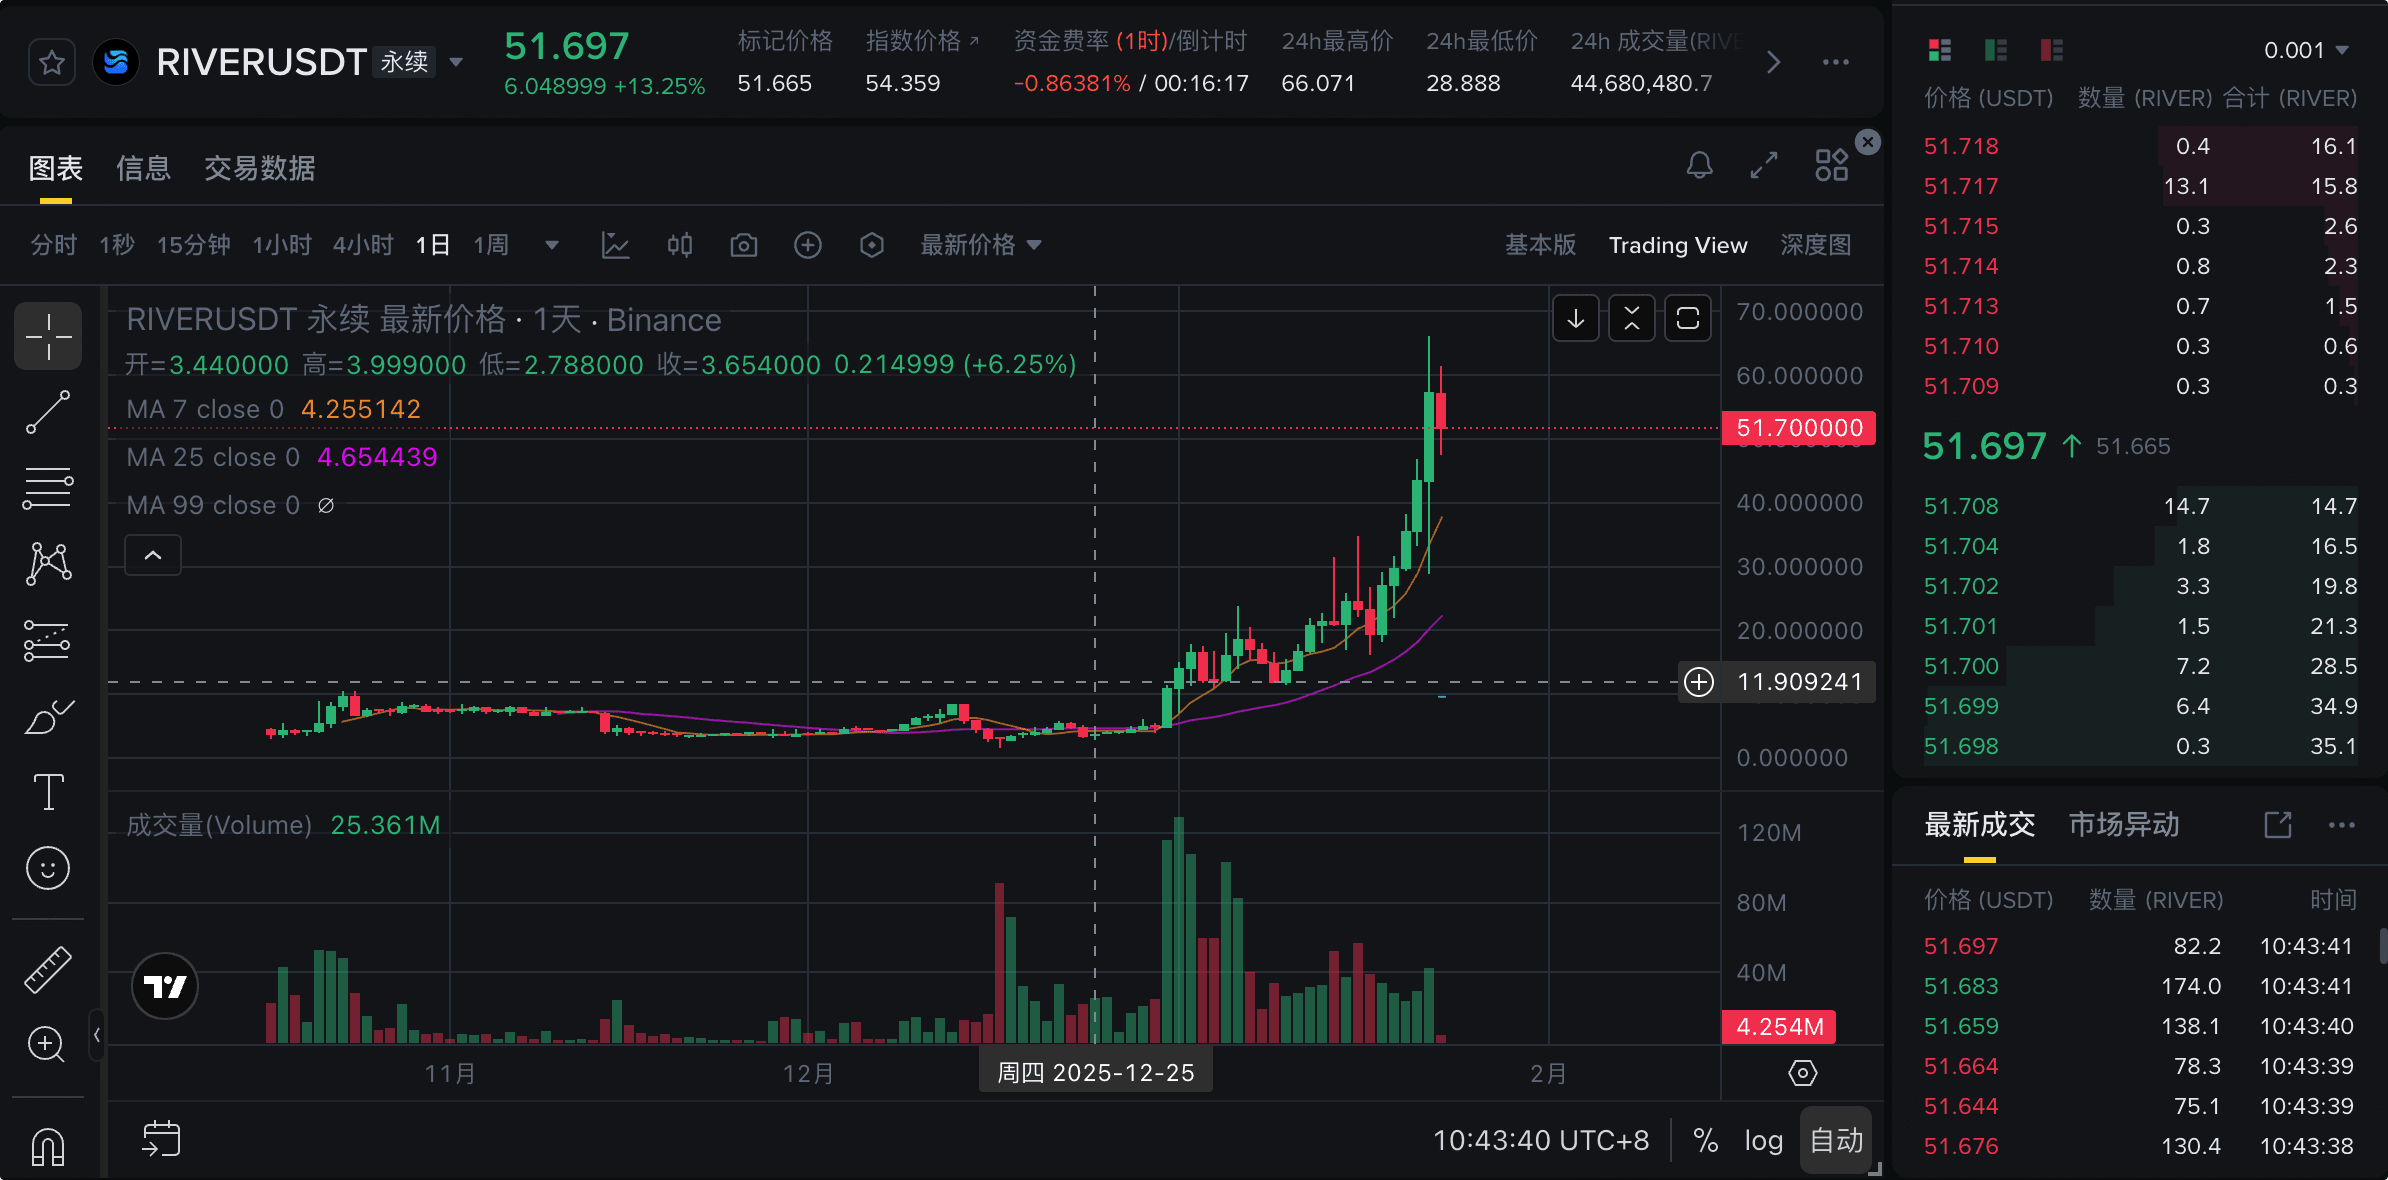
This daily chart illustrates an extremely rare market condition.
Complete distortionThe price surged dramatically from single digits (around $3-$4) in a short period of time.$66The price increase is staggering. The moving average system has completely failed; the MA7 and MA25 are still at rock bottom. The current price is like a kite with a broken string, completely driven by market sentiment.
High-level divergence and trapped positionsAlthough it has currently fallen back to around $51, it is still about [amount missing] away from the high of $66.23%The pullback means that funds that bought at higher prices in the $60-$66 range are now facing significant unrealized losses, and these positions will become a heavy constraint on any subsequent rebound.
Trading volume: The surge in volume indicates that major funds have deeply intervened. Whether the current position represents high-level turnover or major funds distributing their holdings needs to be observed in conjunction with the 4-hour chart.
2. 4-hour chart: Severe turbulence at high altitude
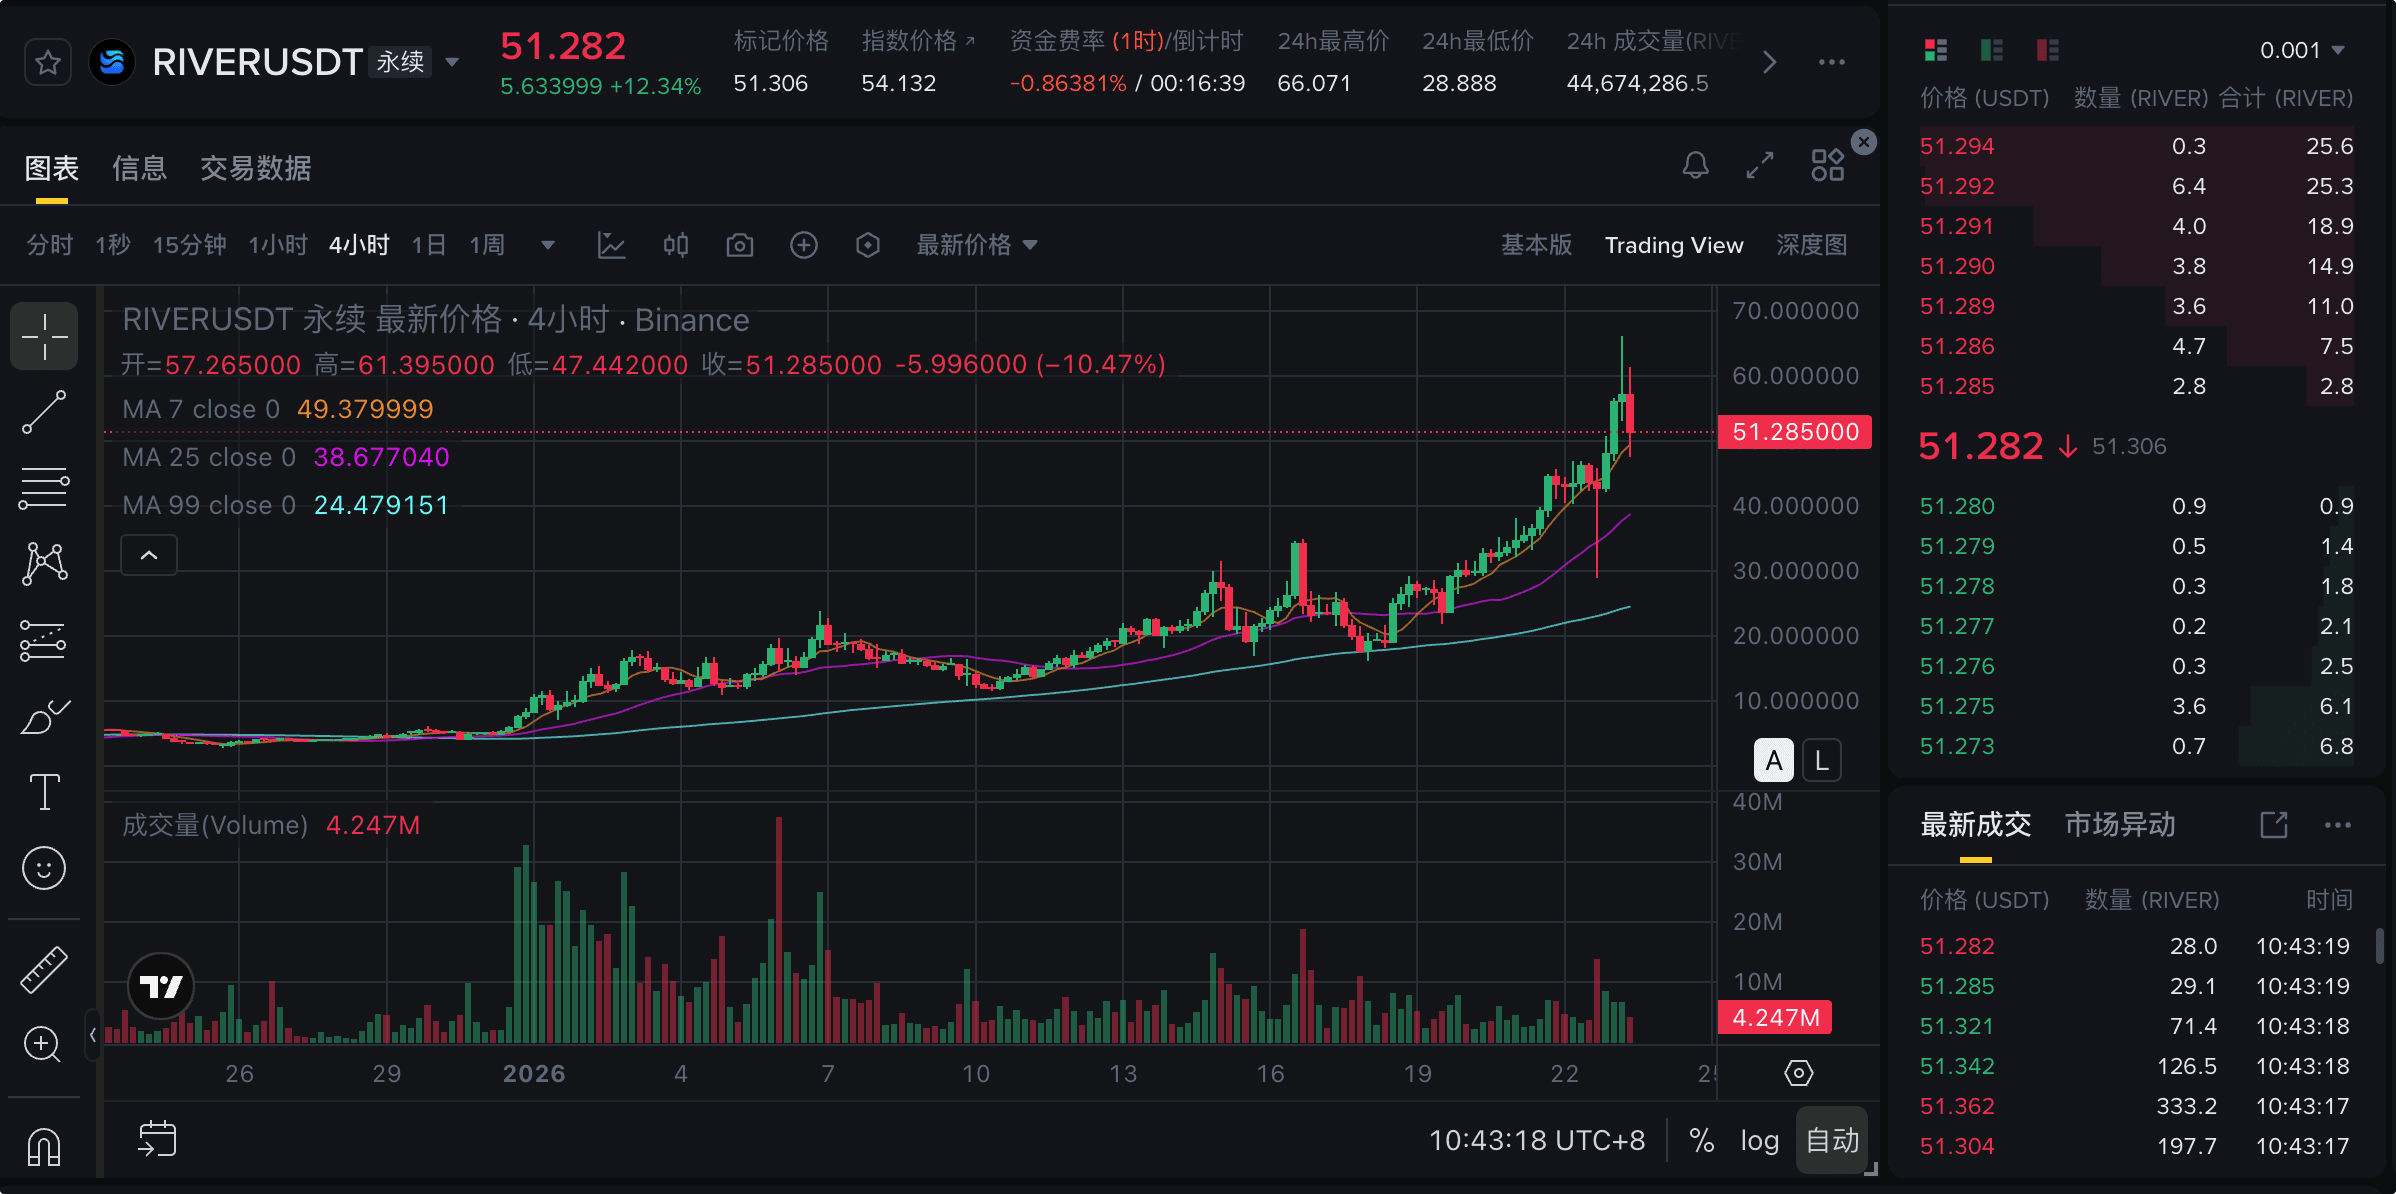
Focusing on the 4-hour chart, this is currently the forefront of short-term trading.
High-level fluctuations confirmed: In creating$66After hitting an all-time high, the price quickly fell back and tested the support level below. This rapid A-shaped drop (from $66 to $47) indicates strong selling pressure from major players and significant selling pressure above.
Key moving average battle:
Lifeline MA7 (yellow line)Currently, the 4-hour MA7 is located at...$49.37Nearby. Although the price briefly fell below [a certain level], it quickly recovered, indicating that short-term bulls are still trying their best to maintain the upward trend.As long as the 4-hour candlestick body does not effectively break below the MA7, the strong trend has not yet ended.
Defense line MA25 (pink line)MA25 is located in$38.67This is the last line of defense for the short-term trend. If it breaks through this level, it will most likely mean the end of this "short squeeze" rally.
Volatility risk: Volatility is currently extremely high, with single candlestick fluctuations often exceeding 10%. There is a huge divergence between bulls and bears at the $50 level, a situation commonly referred to as a "battle of the titans."
3. Forecast of the next trend
Overall tone: High-level, wide-range, large-amplitude fluctuations; be wary of the formation of an "M-shaped" pattern.
With the high confirmed at $66, the amount of trapped capital above is heavier than expected, and the resistance to a rebound will arrive sooner than anticipated.
Scenario 1: Double top reversal, forming an "M-top" (50% probability)
logicThe investors who bought at $66 are eager to break even. It's highly unlikely that major funds will directly drive the price up to free those trapped at $66; instead, they'll likely use a rebound to lure in more buyers before unloading their holdings.
TrendPrices rebounded based on the MA7, but...$58 - $60The price encountered strong resistance at the second-highest point and failed to break through the previous high of $66. It then turned downwards, forming a classic "M-top" pattern, and subsequently accelerated its decline below $47, filling the gap at $38.
Trading suggestion: Watch for signs of stagnation around $60 (such as a long upper shadow). If this occurs, it presents a high-probability shorting opportunity on the right side, with a stop-loss order placed above $66.
Scenario 2: Mid-air refueling, setting a new record (probability 30%)
logicThe hype on social media hasn't died down, and FOMO (fear of missing out) remains strong. Major funds are consolidating around $50, using time to create space while waiting for the 7-day moving average (MA7) to rise and correct the divergence.
TrendThe price fluctuated and consolidated in the $49-$55 range for several periods, digesting the panic selling, before suddenly breaking through $60 with increased volume, and then once again testing $66 and attempting to stand above $70.
Trading advice: It is not advisable to blindly guess the top at this time. If the price can stabilize above $55, it indicates strong support, and aggressive traders can try short-term long positions.
Scenario 3: Liquidity dried up, and the price continued to fall (probability 20%)
logicOnce the hype died down, buying interest vanished instantly, and the market returned to rationality.
TrendThere was no decent rebound; instead, it slowly slid down along the 4-hour MA7, eventually accelerating its decline below $38 and returning to the $20-$30 value range.
Trading advice: This is the most dangerous "boiling frog" pattern. Once it falls below $47 and fails to recover, you should decisively exit the market and observe.
4. Operational Recommendations
In such extreme market conditions, preserving principal is more important than pursuing exorbitant profits.
Currently, $RIVER is in the "plateau of emotions," where the air is thin and the environment is harsh.
For short sellersAvoid holding onto losing positions or adding to positions with a "revenge mentality." The current moving average system does not support blindly shorting. A rational entry point is only when the price clearly breaks below the 4-hour MA7 (approximately $49.3) and fails to rebound, or when resistance is confirmed in the $58-$60 range. Any previous losses were due to extreme market anomalies, not your own fault; do not impulsively try to recover losses.
For bulls: The high of $66 has established a short-term ceiling. Don't fantasize about catching the tail end of every wave. You can move your stop loss to $47.4 (previous low). Hold as long as it doesn't break, and exit immediately if it does.
Remember, $66 is a mountain built of capital; it takes enormous energy to climb it. Without any new major positive news, be wary of major players creating a "bull trap" at high levels.
Disclaimer: The cryptocurrency market is highly volatile and risky. This analysis is for informational purposes only and does not constitute investment advice.
