Instead of falling, the coin updates its historical maximum every day🚀
In 7 days, the coin has grown by 450%🤯🤯🤯And you say: There is no alt season😂 You just don't see it❗❗❗
But the fall will happen, however, many are waiting for it ❓
Let's ask the indicators🤔
RCI on the daily timeframe above 95 tells us about overbought conditions🤔And this indicates an upcoming correction🤔
What will the trend lines say❓❓❓
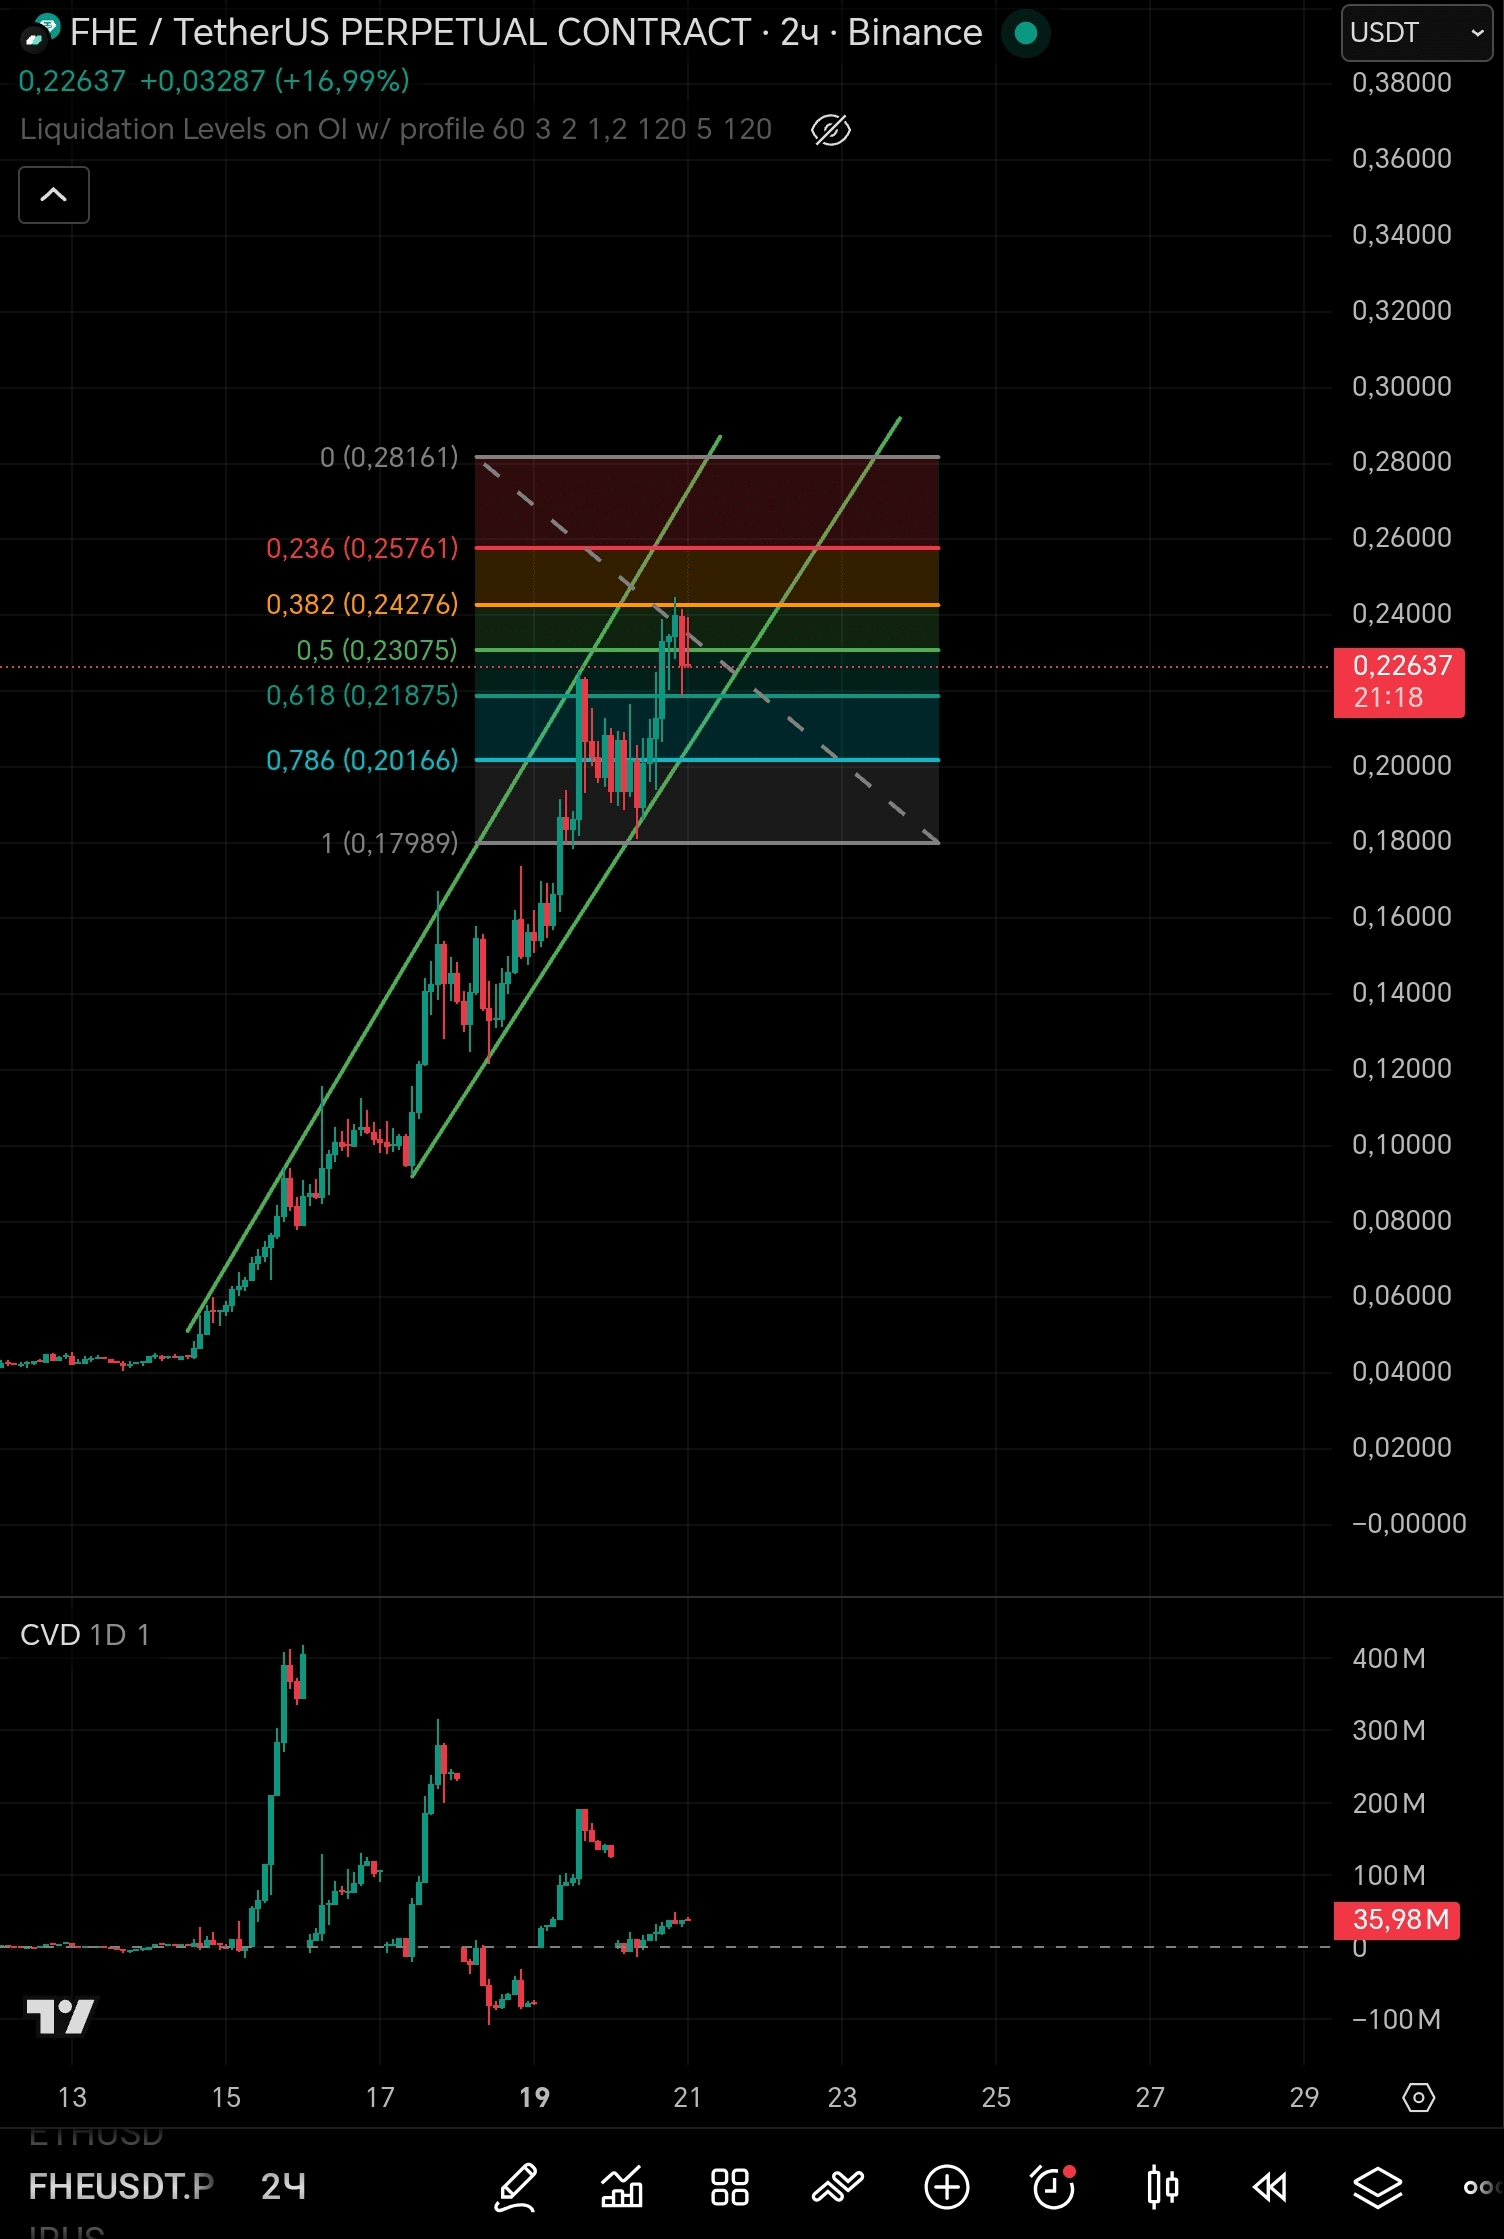
They keep whispering: "don't open a short position, it will be liquidated, we can calmly reach 0.250 today, or maybe even 0.280 don't you see that the growth wave is smaller than the others❓❓❓"
Some hear this whisper, while others continue to open shorts for several days in a row, ignoring one simple tool "trend lines" which only once during this entire growth showed us a hint of a price drop🤔
Even with the drop $BTC the coin did not react at all, everyone fell, and this one didn't even budge😂
Doesn't anyone want to save their money❓ Why are you going short, and even worse, hoping for a drop and your profit turns into a loss❓
Don't think about how you can make a big profit, think more about how to preserve your deposit and margin👆
Therefore, the safest moment is to wait for the upward movement to change its trend, the coin will go below the lower trend line and from there try to take a short👍
So: We assumed the upper limit of growth, where to enter short, and to what level will we fall❓❓❓
Let's refer to the advice on Fibonacci levels🤔
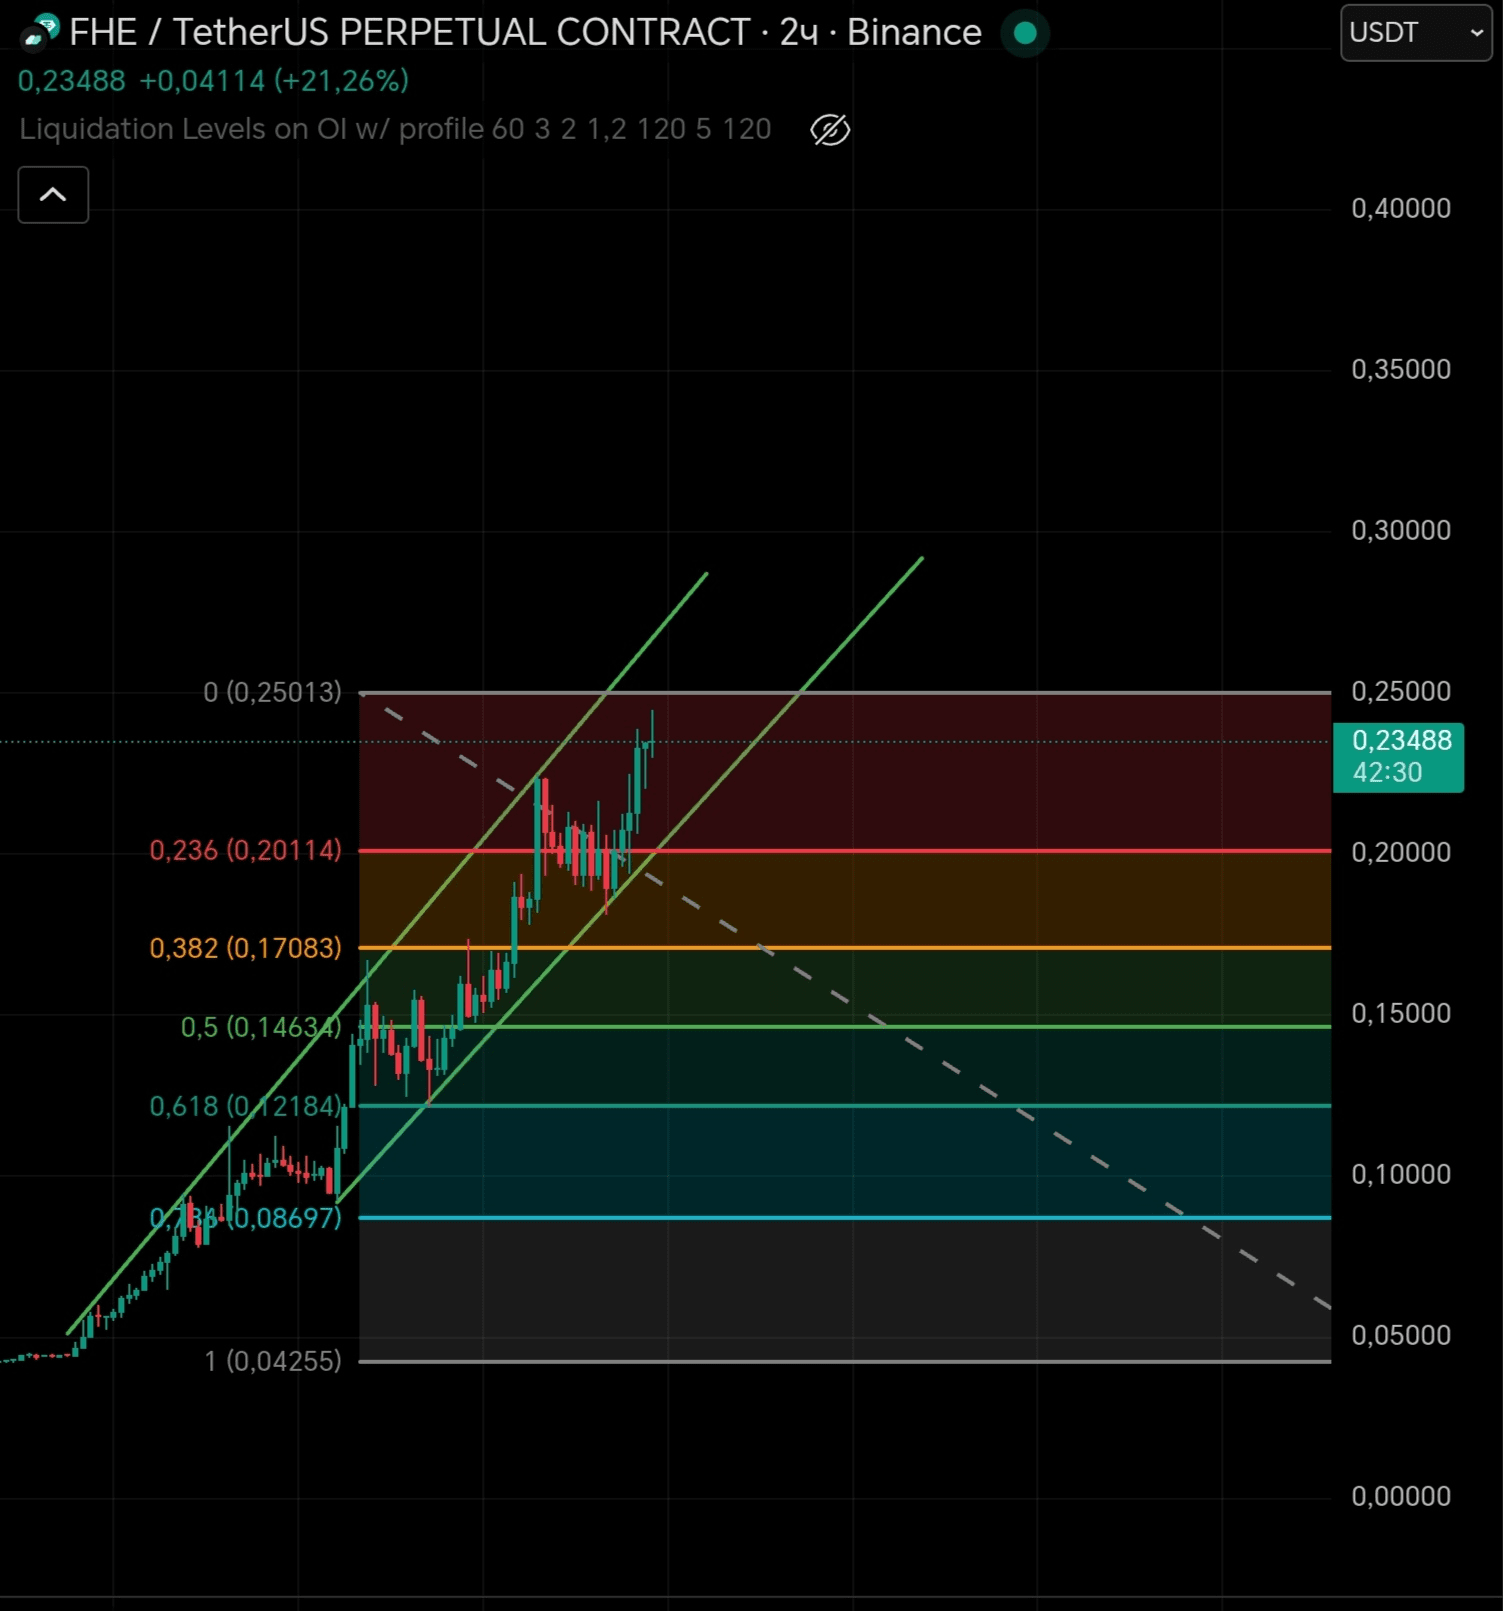
If we stretch the grid according to the current impulse, and assume that the coin will reach 0.25 today, we will find out the following🤔
✅Level 1: 0.236 according to Fibonacci tells us that the price can drop by 23.6% relative to the current impulse to the mark 0.20114. But this is a weak correction, if we see a reversal at this point, then we will fly not to the moon, but to Mars😂😂😂
✅Level 2: 0.382 According to Fibonacci tells us: "Guys, the price is at the golden ratio, be careful, it will bounce off me soon". And the price in that area is 0.17083
✅Level 3: 0.50 This is not a Fibonacci number, but included in the tool because it is a psychological level, exactly 50% decrease from the current impulse, often coins touch this level only with shadows at this point the price will be 0.14634🤔
✅Level 4: 0.618 This is the second golden ratio, we often observe it when the coin is heavily overbought and sellers are actively pushing the price down, but this doesn't tell us anything about a drop. Simply put, buyers are tired and need to rest😂 But they will return, believe me, with new strength😂 We will see the price at 0.12184👍
✅Level 5: 0.786 From here it is very hard to return to the top in growth😂 This is a drop of 78.6%. Of course, there are tough nuts, like $DASH Look at its daily chart, it even went below this mark, but that didn't stop it from returning and giving us +100% growth in a few days👍
Remember: It's more important not to lose money than to make it❗ Don't treat cryptocurrency like a casino, you know that casinos win 80% of the time❓ Don't succumb to greed and don't rely on luck, they will only ruin you😔
Look at the charts that are understandable for you, draw, calculate, find entry points.
By the way, I've been crazy about the chart $RIVER for several weeks, if only all were like this, the coin moves like a clock, 2 days the deal is open, 2 days I sleep peacefully, don't panic, waiting for 39.20💰-40.00💰
I wonder if my advice helps anyone❓ Was there anything in my posts that was useful to you❓ Or maybe you decided not to rush into opening a deal❓

