Hello, Binancians! Today we analyze the 4-hour chart of DUSK/USDT, which has shown explosive movement recently. Here are the key points that every trader should observe right now:
🔍 Price and Trend Analysis
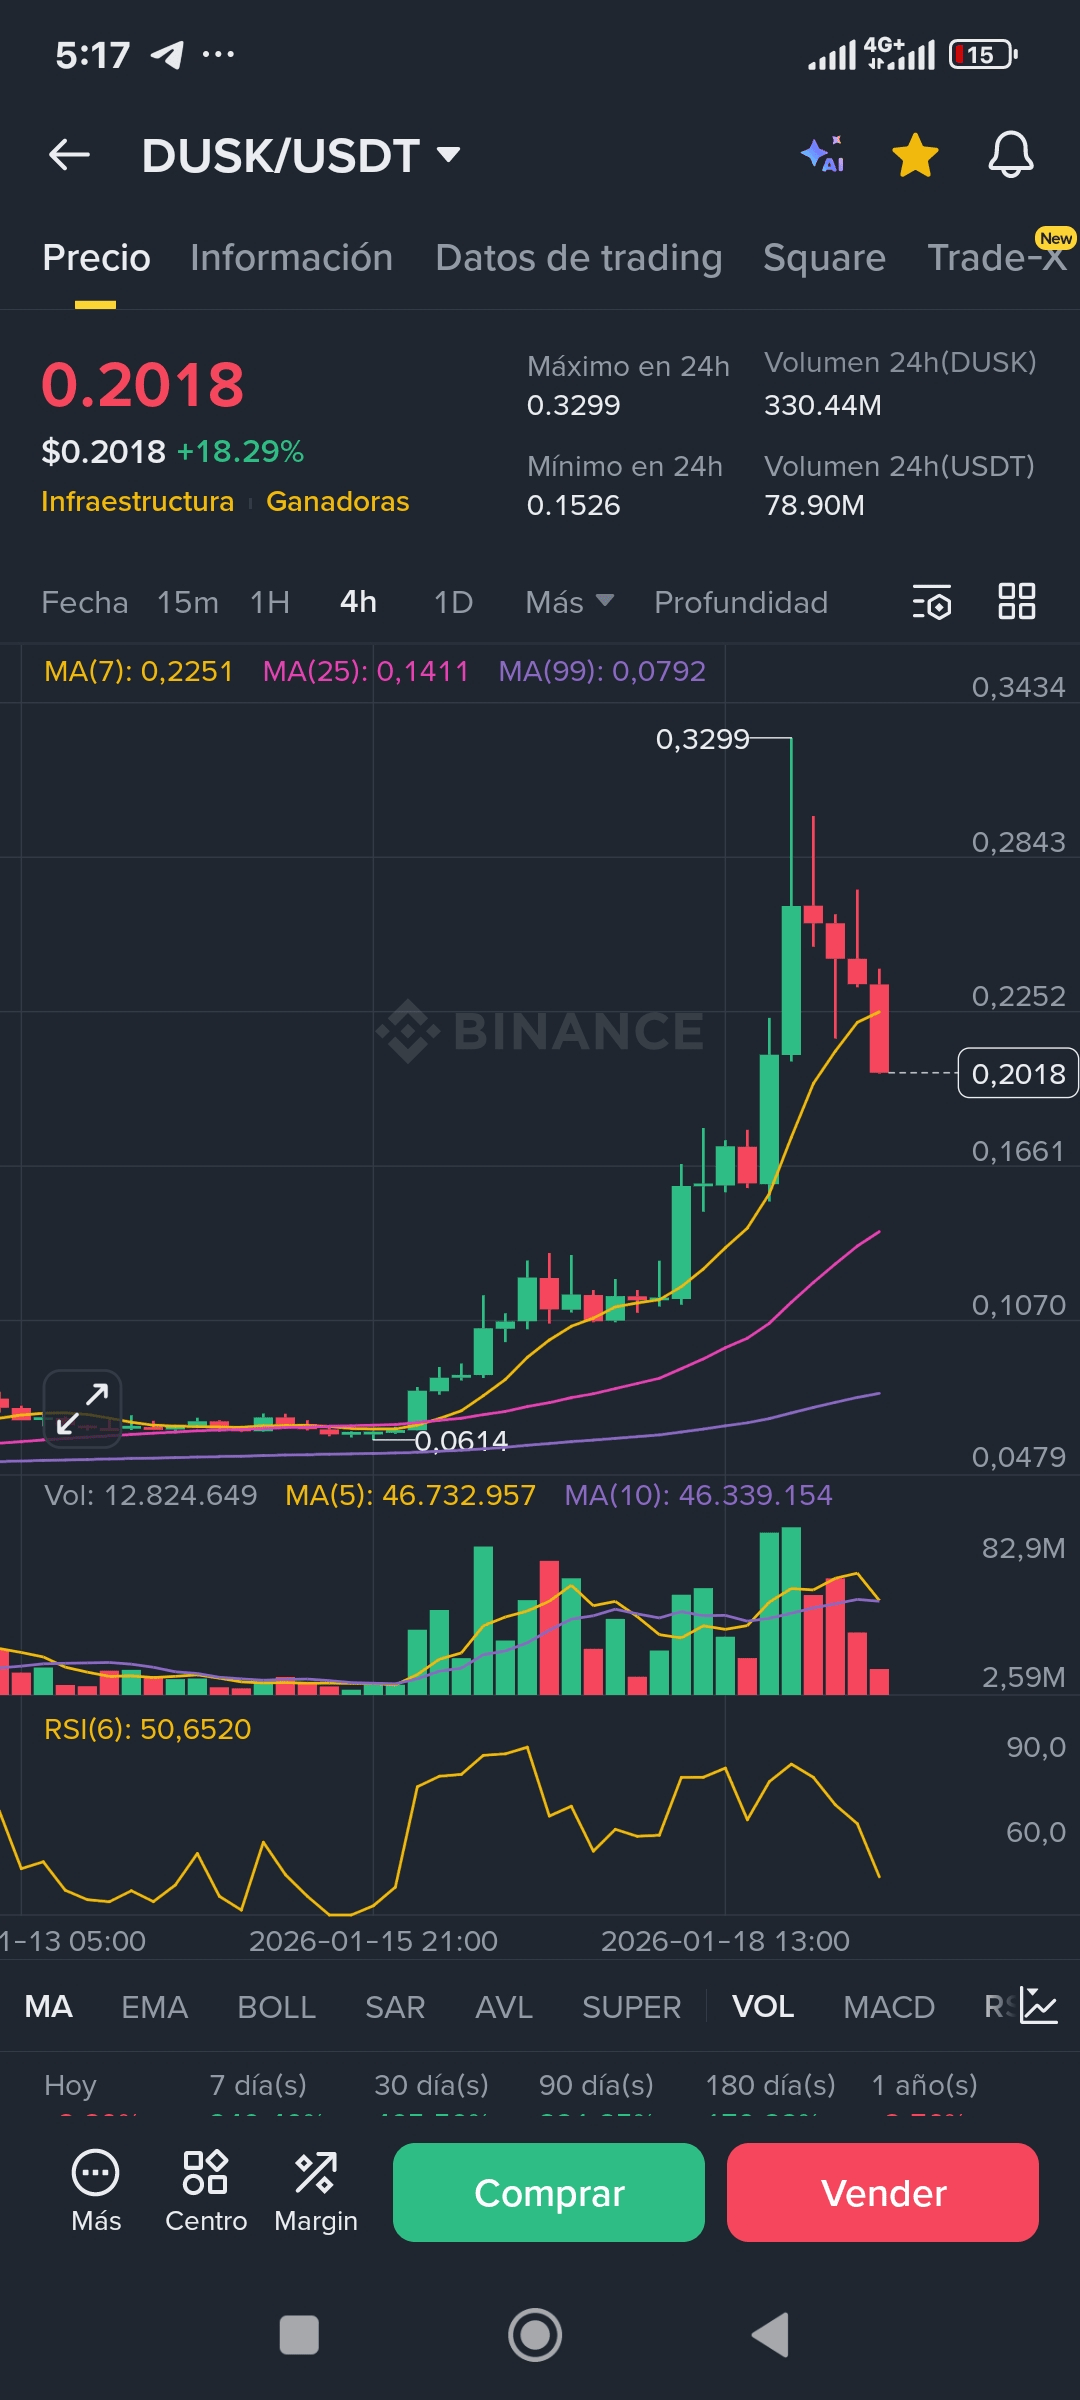
Current Status: The price is trading at $0.2018, with an increase of +18.29%.
Price Action: After reaching a local high of $0.3299, the asset has entered a correction phase. We are seeing consecutive red candles looking for a floor after the pumping.
Moving Averages (MA):
The MA(7) (yellow) is at $0.2251, now acting as immediate resistance after the price crossed below it.
The MA(25) (purple) is at $0.1411, representing an important dynamic support in case the correction continues.
📊 Technical Indicators
RSI (6): It stands at 50.65. This is very interesting: after being in the extreme overbought zone (above 70-80), the RSI has neutralized. This indicates that selling pressure is balancing out and the asset is "catching its breath."
Volume: We see a massive volume spike on the rise, but the volume of the correction candles is lower, which is a positive sign; it suggests that there is not a massive capital outflow, but rather normal profit-taking.
🎯 Key Levels to Watch
Immediate Resistance: $0.2250 (coincides with MA7). Breaking this level with volume would confirm the bullish continuation.
Critical Support: $0.1526 (minimum of the last 24h) and the area of $0.1400 where MA(25) is expected. If it holds here, a solid base could form for the next "leg up."
💡 Personal Opinion:
DUSK has had an impressive rally. Entering now is risky due to volatility, but watching the support at $0.15 - $0.16 could offer a safer entry opportunity for those looking for the rebound. Always with Stop Loss! 🛡️
What do you all think? Will DUSK reach $0.40 or will it return to the base? I read your comments. 👇

#dusk #CryptoAnalysis #tradingtips #BinanceSquare #TechnicalAnalysis