What is the Bollinger Band pattern? How to determine market changes?
In technical analysis, the Bollinger Bands are not just rigid three lines, but a technical indicator that analyzes market volatility and visualizes trends for investors. The Bollinger Bands consist of three core components:
Middle Band: default is the 20-day simple moving average SMA 20.
Upper Band: Middle Band + 2 times standard deviation.
Lower Band: Middle Band - 2 times standard deviation.
Volatility reflects market sentiment: the key to pattern formation
The most distinctive feature of the Bollinger Bands is the introduction of the concept of standard deviation, which in statistics is used to measure the dispersion of data, while in the market it can represent market volatility.
With a default value of 2 standard deviations, the price will be within the upper and lower bands 95% of the time. Therefore, when the price touches the upper and lower bands, it often indicates that the market has entered an extreme or special state.
What can patterns predict? Four major market signals
By observing the changes in the width of the upper and lower bands of the Bollinger Bands and the position of the K line relative to the bands, one can usually determine what stage the market is currently in and predict the possible market direction. The channel can reveal four major signals: ambush explosion, explosion, continuation, and reversal. The detailed identification methods will be discussed in the next section.
Overview of Bollinger Band Patterns
The changes in the Bollinger Bands' patterns actually represent a process of momentum accumulation gradually exploding until exhaustion. This section summarizes the overview of patterns into the following table for the readers' convenience.
Market Signal Correspondence Pattern Characteristics Operation Logic Preparation Period (Momentum Accumulation) Bollinger Band Convergence (Narrowing) The distance between the upper and lower bands shrinks to a minimum, and K line volatility is minimal. Observation Waiting Period (Confirming Trend) Bollinger Band Expansion (Widening) The distance between the upper and lower bands gradually widens, and the K line approaches a single band for entry. Continuation Period (One-sided Market) K line breaks the upper/lower bands, maintaining the expansion of the channel, and the K line sticks closely to the upper/lower bands to continue holding profits or even add positions. Exhaustion Period (Possible Reversal) The Bollinger Bands' opening gradually converges, or the K line creates new highs/lows but does not touch the bands, leading to profit-taking or reverse operations.
Bollinger Band Narrowing Convergence Pattern
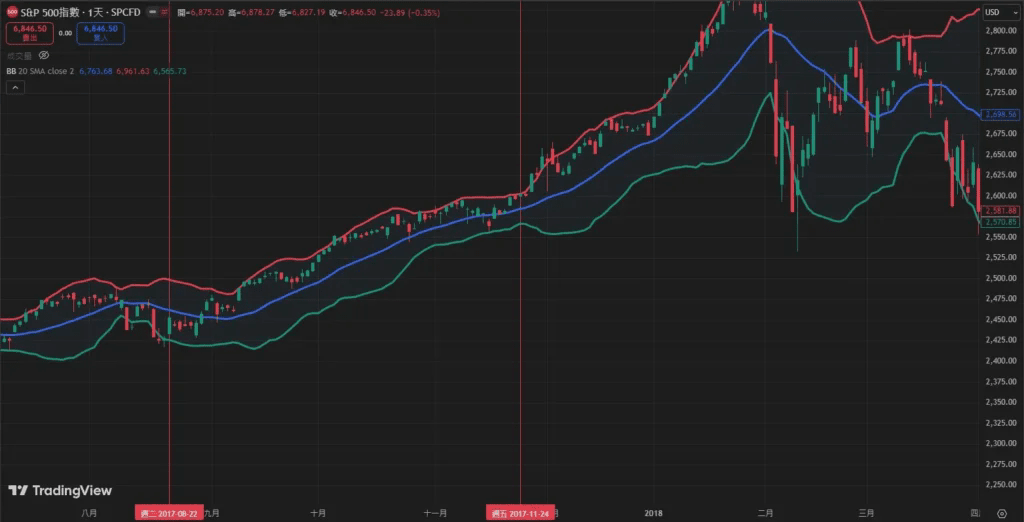
Among all the patterns of the Bollinger Bands, narrowing convergence has the most profit potential, and it is also a stage that requires the most patience to wait. Convergence usually means that the market is about to welcome a wave of upward or downward trend. The characteristics of Bollinger Band convergence are:
Distance between upper and lower bands shortens: The upper and lower bands continuously approach the mid-band, and the channel's width becomes very narrow.
K line volatility is low: Mostly short-bodied K lines with minimal volatility.
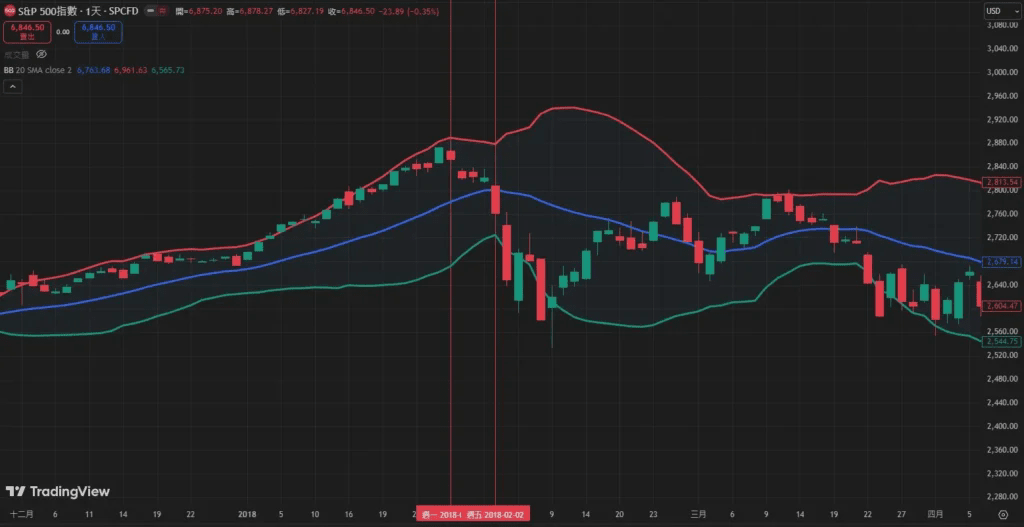
Taking the following chart as an example, the S&P 500 from August to November 2017 saw the Bollinger Bands gradually narrow from a previously wider appearance. Although the market seemed to be rising slowly, it was actually just a sign before the trend explosion.
Bollinger Band Widening Expansion Pattern
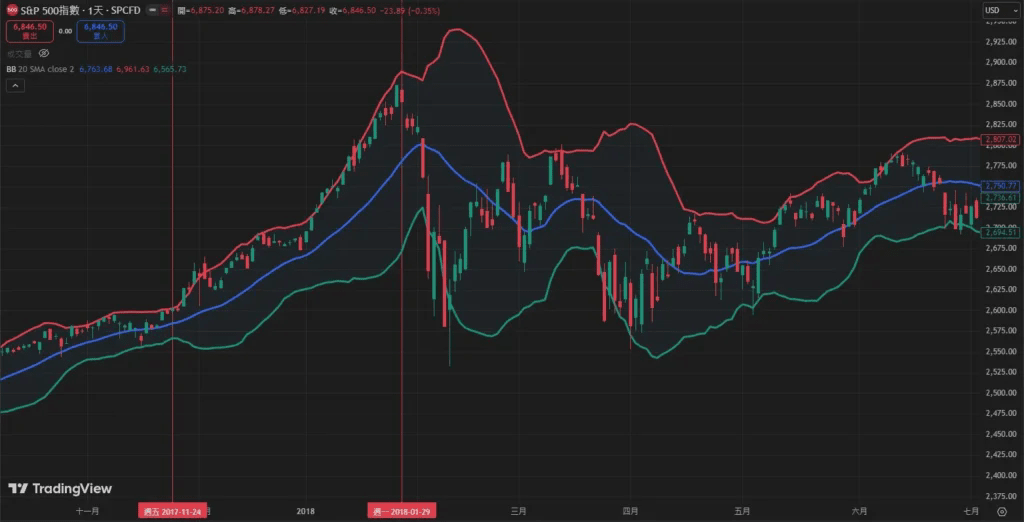
If convergence is about ambushing the trend, then expansion is when the market explodes. Channel expansion usually occurs after the convergence pattern, indicating that the price has broken away from the consolidation range and a one-sided trend has begun. At this time, volatility increases, leading to a widening distance between the upper and lower bands. The longer the distance between the bands, the stronger the market's uptrend.
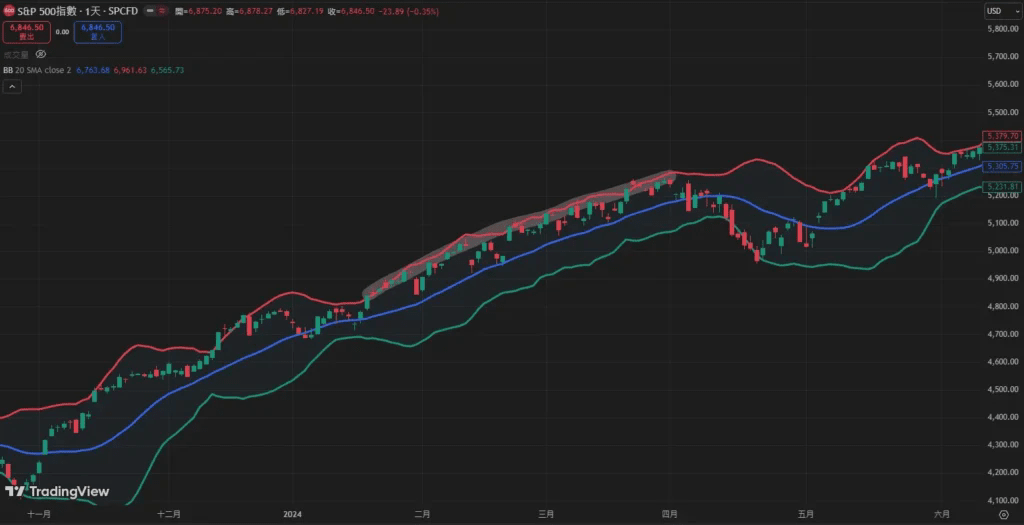
The chart below shows that after the Bollinger Bands contracted in November 2017, a strong upward trend lasting two months was initiated, during which the Bollinger Bands continuously expanded and the K line never returned to test the mid-band, indicating sufficient upward momentum.
Bollinger Band Breakout Pattern
When the Bollinger Bands begin to widen, we need to closely monitor the specific position of the K line chart. Is the trend going to rise or fall? If the direction is misobserved, there is a high possibility of facing stop-loss during a strong one-sided market.
Many investors have a common misconception that touching the upper band signifies overbought, and they should take profits or even short. However, in the logic of the Bollinger Bands, when the upper and lower bands gradually expand, touching the upper band is often not a sell signal but a buy signal.
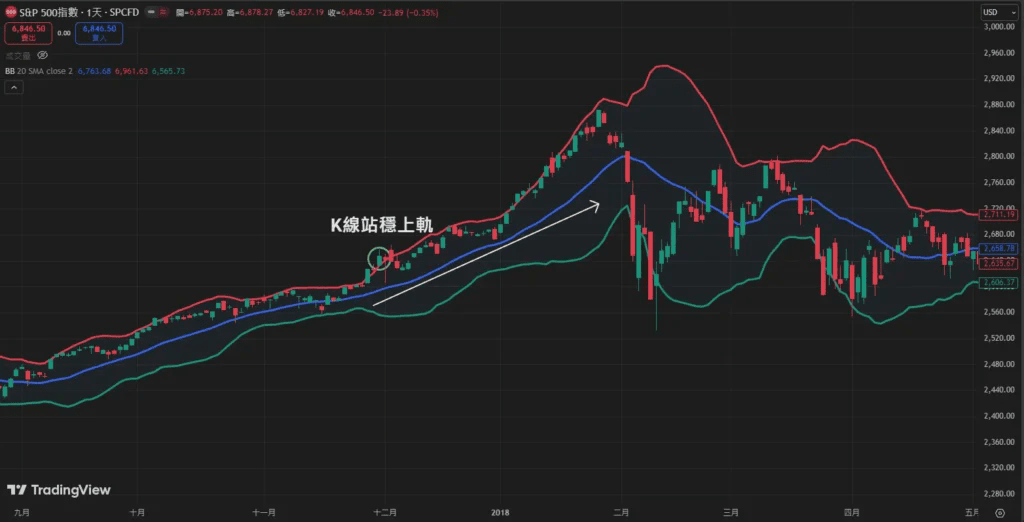
Upper Band Breakout
When the K line's closing price clearly stands above the upper band of the Bollinger Bands, it signifies an upper band breakout. At this point, the buying pressure in the market is very strong, and the upward momentum has exceeded the normal volatility range. Although the price may seem high, the trend has just started, and there are often higher points to expect in the future.
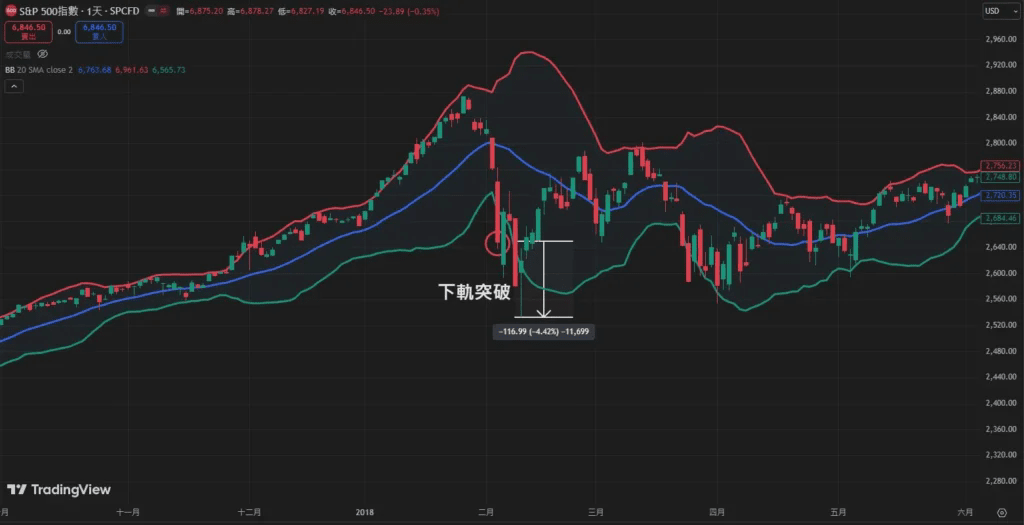
Lower Band Breakout
Lower Band breakout is the opposite of the upper band breakout. The breakout occurs when the K line's body firmly stands at the lower band of the Bollinger Bands, indicating significant selling pressure in the market and extreme pessimism. For trend traders, this often represents a good opportunity for shorting or a warning for long positions to immediately stop loss and exit.
Bollinger Band Reversal Pattern
The Bollinger Bands can not only ambush the trend through convergence patterns, but also trade through breakout patterns during expansion. Additionally, they can determine when a reversal might occur by observing the price deviating from the average value and returning to the mid-band. The simplest and most intuitive way is through the observation of momentum shrinking (contraction) during expansion to determine whether the market has lost upward momentum.
Similarly, taking the following trend segment as an example, when the Bollinger Bands transition from expansion to convergence, it is necessary to pay attention to the potential reversal possibility, especially when the price breaks below the mid-band, as it is very likely that the market trend has shifted from upward to downward.
Bollinger Band Trend Continuation Pattern
As mentioned earlier, in the Bollinger Bands indicator, touching the upper/lower bands does not signify overbought or oversold, but rather may indicate a continuation of the trend. At this point, users may observe several signals related to trend continuation:
Price sticking to the track: The K line moves along the upper or lower band without approaching the middle band.
Small retracement: Even if there is a brief pullback, it remains close to the upper and lower bands.
Indicator dullness: At this time, if you observe indicators like RSI and KD, you will find that they have remained in the overbought or oversold zone for a long time.
How to apply Bollinger Band patterns in actual trading?
The Bollinger Bands can give rise to various trading strategies in the market, the most common of which involves breakout trading through channel convergence and trend trading during channel expansion. The following will provide examples of two methods applied in the actual market.
Ambush Trend: Entering during Bollinger Band Convergence
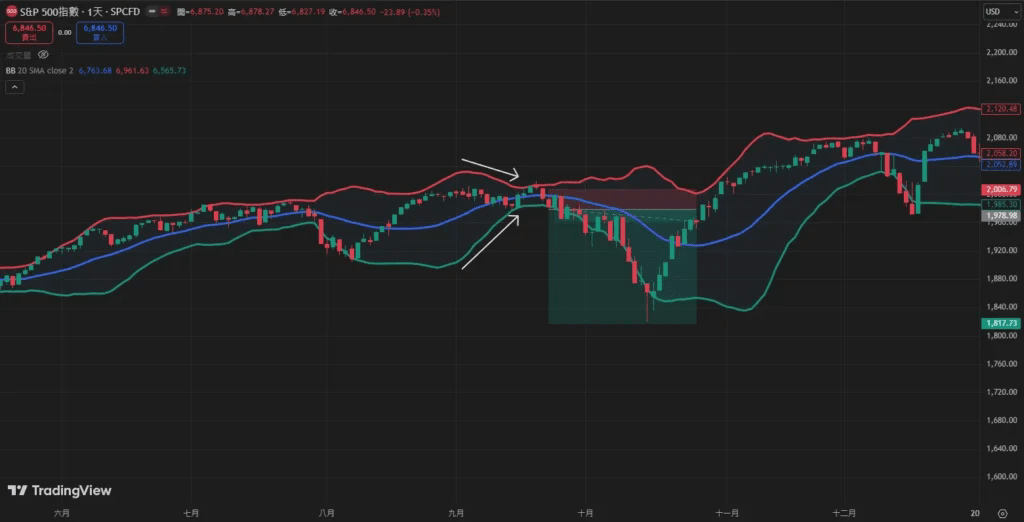
The chart below shows that when the Bollinger Bands converge to the extreme, the price initially touched the upper band and then immediately fell, after which it touched the lower band and conducted a mid-band test. At this moment, one can enter to ambush the bearish trend and set the stop loss above the mid-band, then wait for the trend to occur.
Trend Trading: Entering during Bollinger Band Expansion
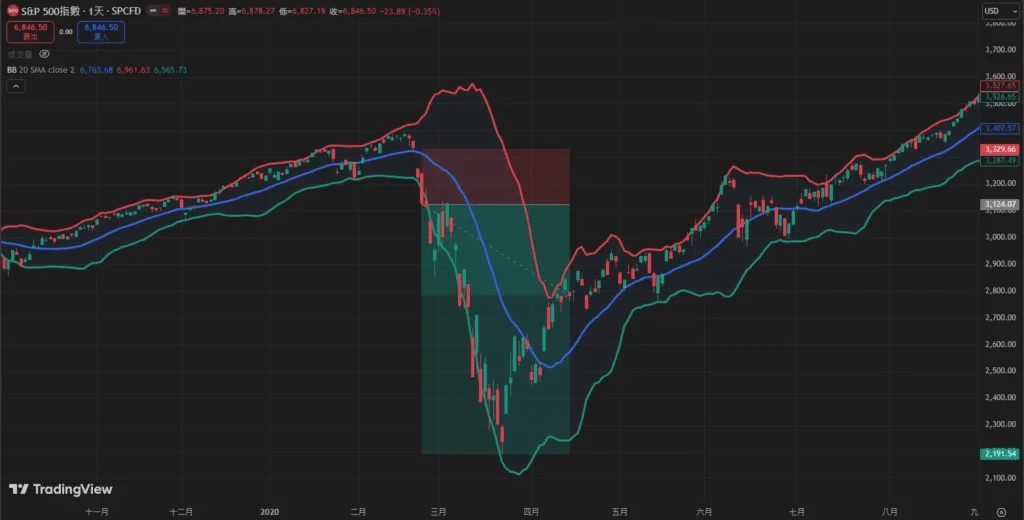
The chart below shows that when the market experiences a decline, the Bollinger Bands instantly open up to an expansion pattern due to increased volatility, and in addition to expansion, a lower band breakout signal is generated. At this moment, one can enter a short position in line with the trend and set the stop loss above the mid-band. As long as the price does not cause the Bollinger Bands to converge or return above the mid-band, one can maintain the position.
Frequently Asked Questions
Does Bollinger Band contraction mean there is no market movement?
On the contrary, a contraction represents low volatility in current prices, but market trends often occur after convergence patterns. Therefore, contraction is precisely the moment to observe subsequent trends.
Does a K line breaking the upper band always mean bullish?
Not necessarily, the Bollinger Bands can also give false signals. If the price briefly breaks the upper band but closes with a long upper shadow falling back inside the channel, it could be a false signal to entice buyers.
Is it necessary to use other indicators together?
It is recommended to use other indicators for better results. If multiple indicators simultaneously emit bullish/bearish signals, the success rate is generally better than relying on a single signal.
Summary
The Bollinger Bands, seemingly simple with three lines, can give rise to various different trend identification patterns. This is precisely the interesting part of the indicator. Once you master it, you can ambush early and obtain a better entry cost through convergence, and also predict that future trends may not meet expectations through reversal patterns and exit early. However, investors should still be reminded that the Bollinger Bands can also have false signals, and it is still recommended to use them in conjunction with other technical indicators in practical applications.
This report is for informational sharing purposes only and does not constitute any form of investment advice or decision-making basis. The data, analysis, and views cited within are based on the author's research and public sources and may contain uncertainties or be subject to change at any time. Readers should make prudent investment judgments based on their own circumstances and risk tolerance. For further guidance, it is recommended to seek professional advice.