
Why the Bitcoin "Crash" is a Sector Rotation in Disguise
1. The Illusion of the Market Top
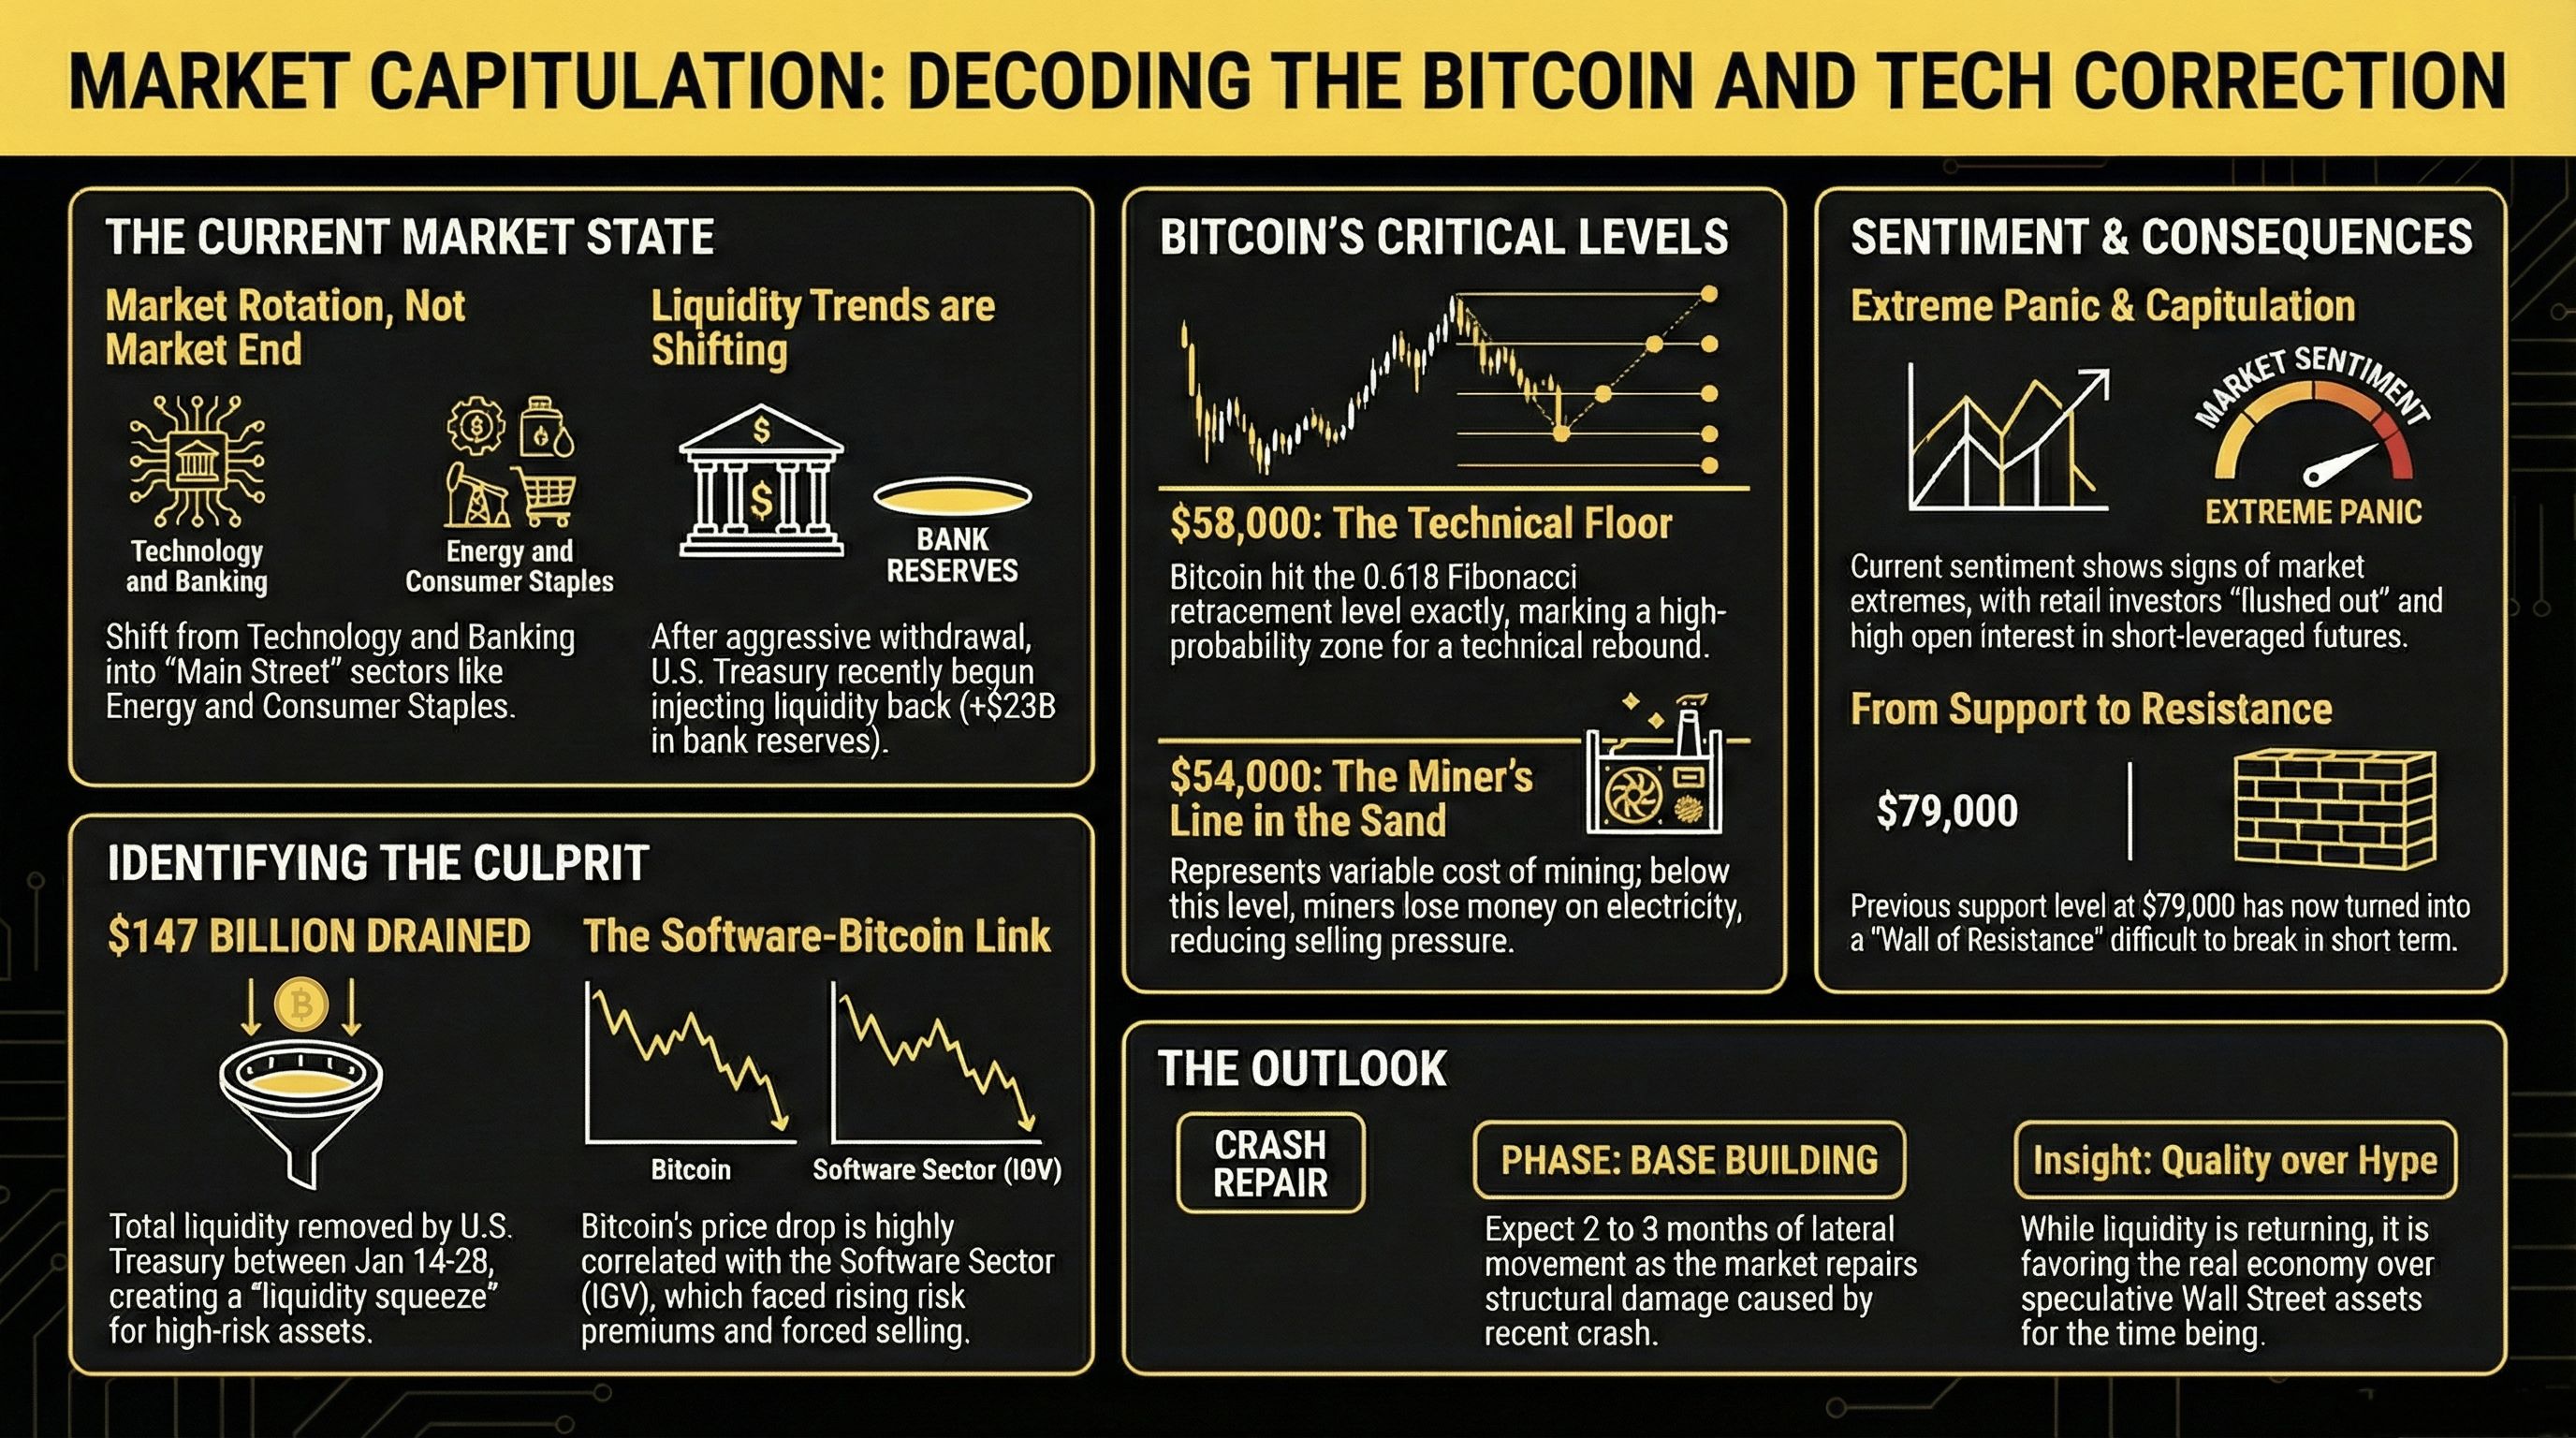
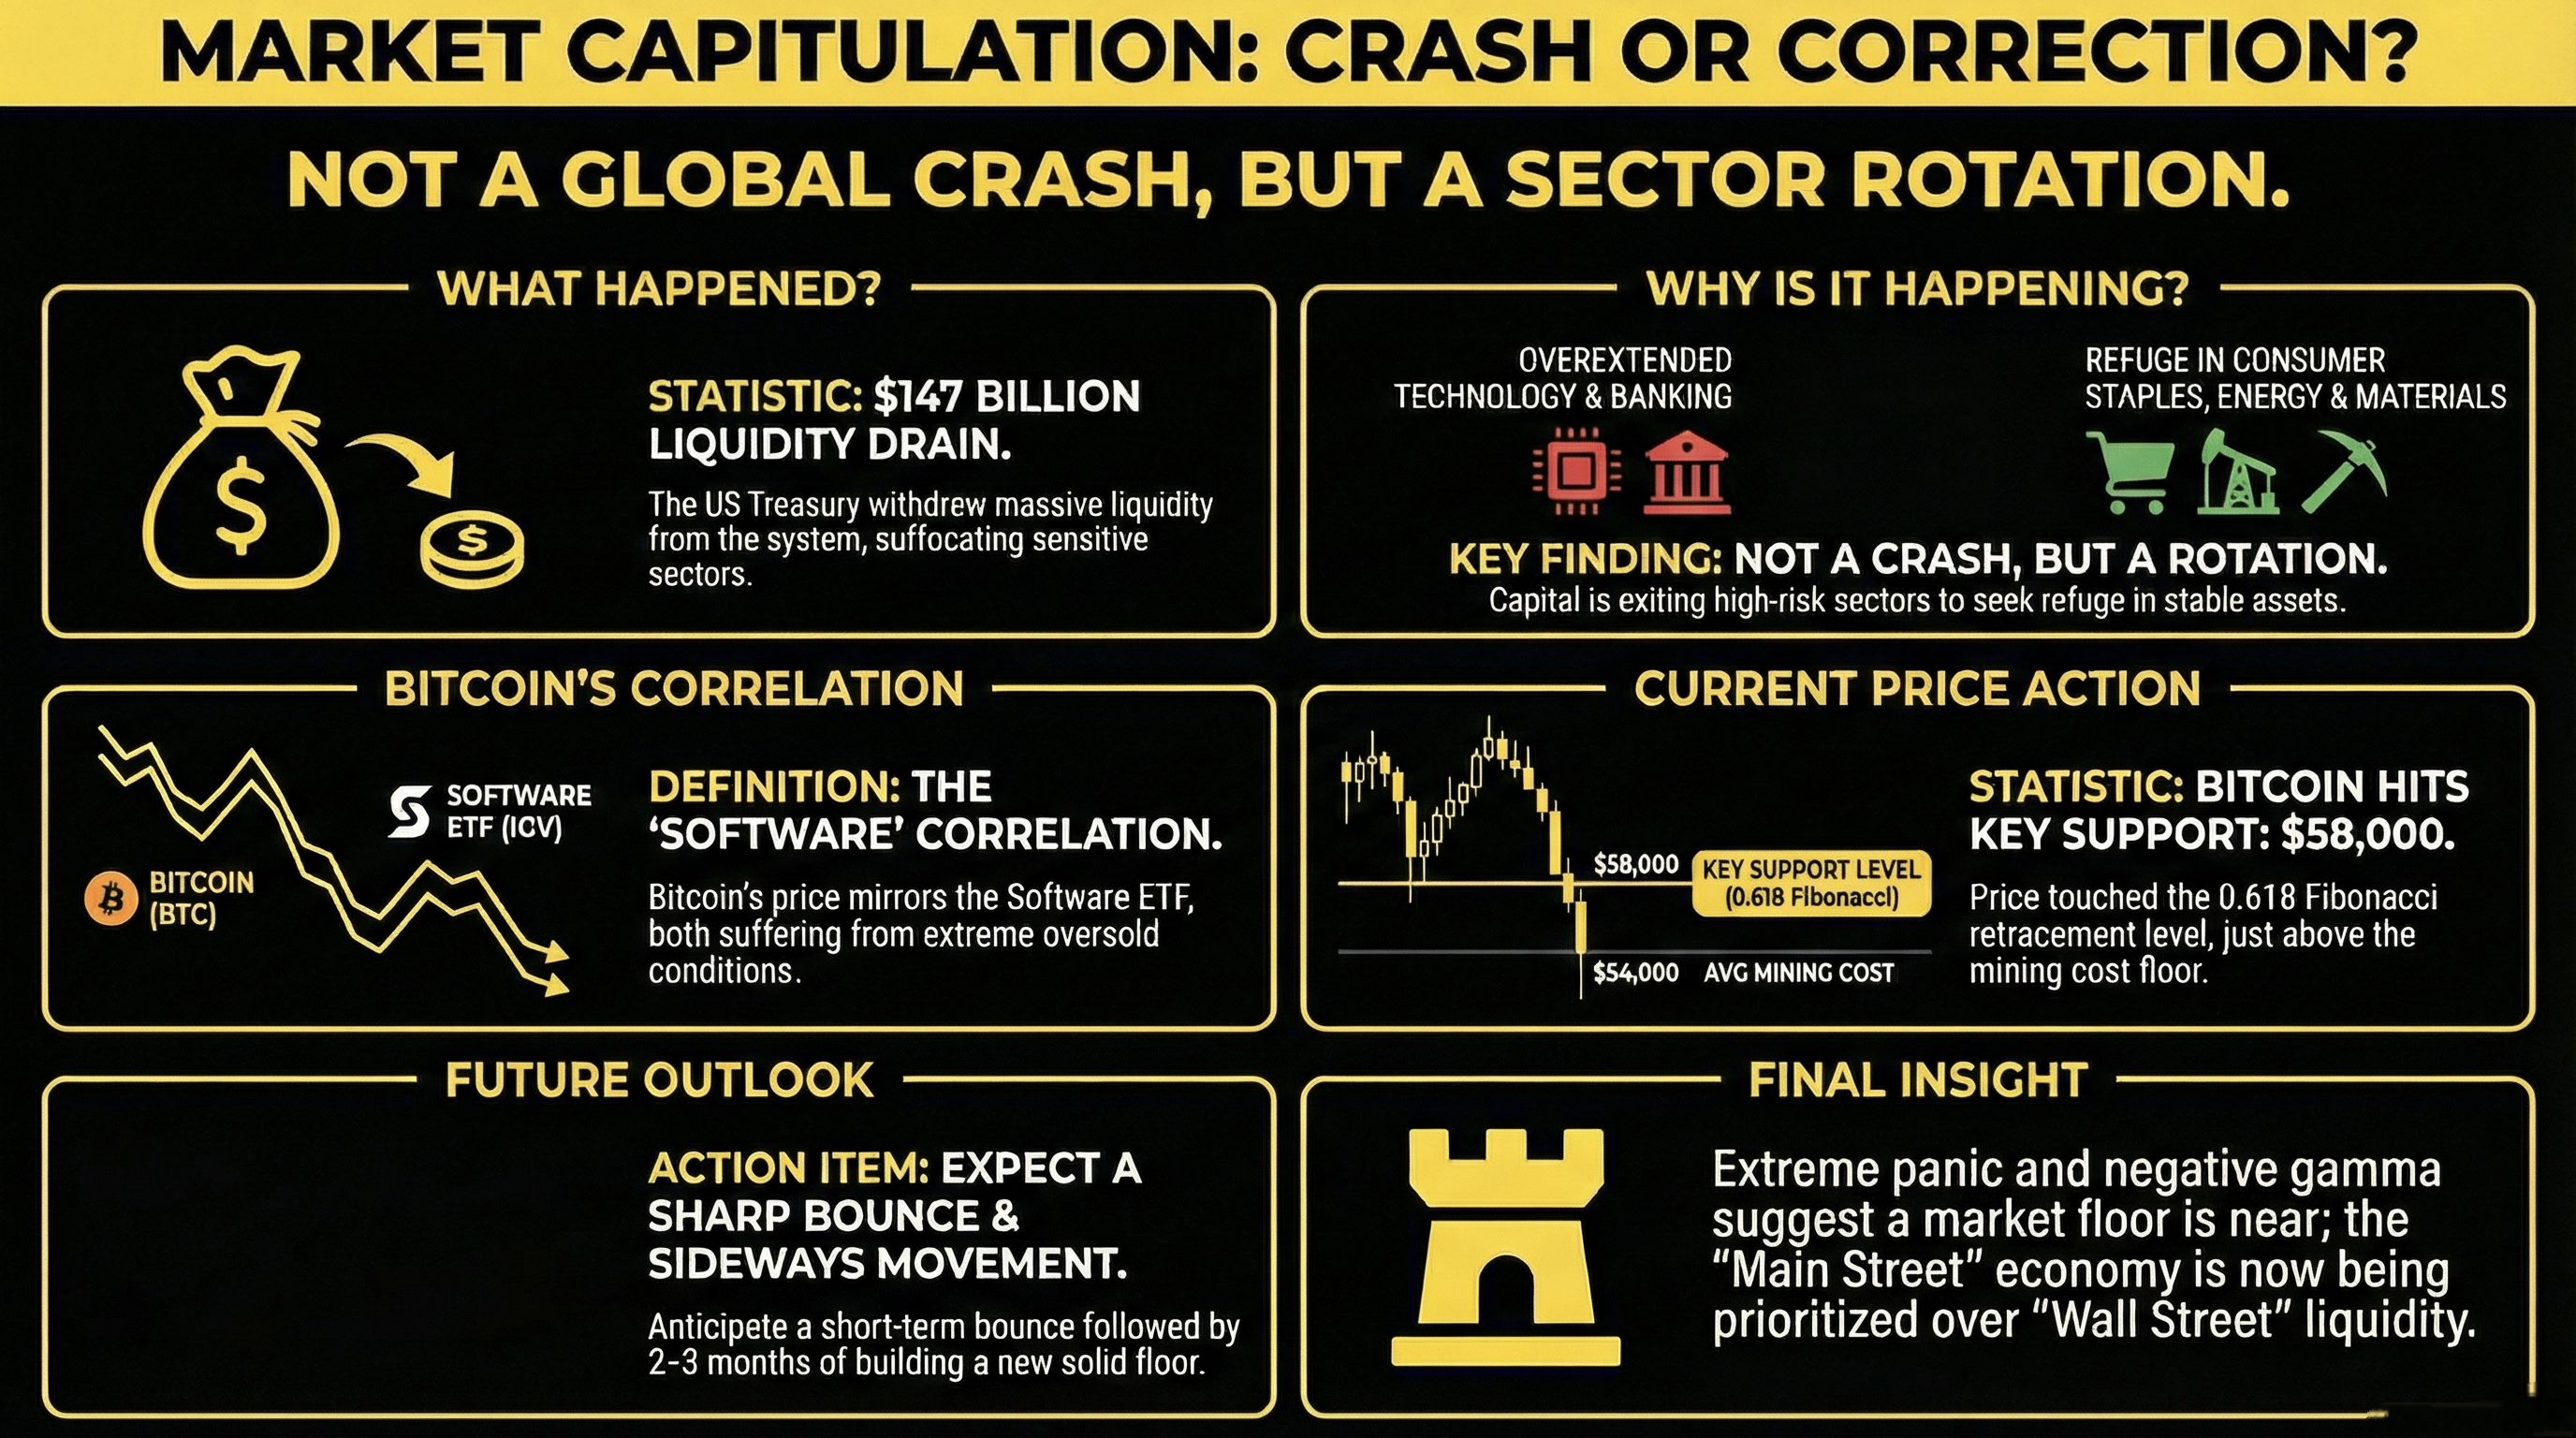
To the undisciplined observer, the recent volatility in digital assets and equities signals a terminal market top. However, a structural diagnostic reveals a more nuanced reality: we are navigating a period of mechanical deleveraging and a sophisticated rotation of capital rather than a secular trend reversal. The strategic imperative is to distinguish between a cyclical correction and a structural shift. Currently, we are witnessing a massive migration of funds away from overextended sectors—specifically Technology and Banking—and toward defensive, "real-world" verticals such as Consumer Staples, Energy, and Basic Materials.
The "So What?" factor is critical: this rotation confirms that the bull market remains fundamentally healthy. Capital is not fleeing the ecosystem into the sterility of cash; it is being reallocated within the equity and risk-asset framework to find more favorable risk-adjusted entries. While the price action provides the headlines, the invisible driver of this transition remains the shifting mechanics of global liquidity.
2. The Invisible Hand: US Treasury and the $147 Billion Drain
Liquidity is the ultimate arbiter of price for high-beta speculative assets. When the fiscal taps are tightened, the market "weather" shifts from expansion to contraction. Between January 14 and January 28, the US Treasury executed a massive, two-stage extraction of liquidity from the financial system. The first wave detracted $94 billion, followed by a second withdrawal of $53 billion, resulting in a staggering $147 billion cumulative drain. This contraction created a localized "liquidity squeeze" that hunted for the weakest links in the financial chain.
The acute pressure, however, is beginning to plateau. Federal Reserve balance sheet data from January 28 to February 4 shows the Treasury’s liquidity extraction has paused, with bank reserves actually increasing by $23 billion. This suggests the worst of the detractions are behind us. Yet, while the broader indices survived, the liquidity drain acted as a catalyst for a concentrated breakdown in a specific borrower class: Software.
3. The Software Contagion: Bitcoin’s Hidden Correlation
To understand Bitcoin’s recent drawdown, one must look past crypto-specific narratives and analyze localized solvency and risk premiums. While global risk premiums remain remarkably stable—as evidenced by the lateral movement in High-Yield Corporate Bonds (HYG)—the distress is concentrated within the software sector. Bitcoin has developed a high-beta correlation with the Software ETF (IGV), acting as a liquidity proxy for the lenders and investors currently being squeezed in that space.
Signs of Software-Led Distress:
Historical Momentum Lows: Bitcoin’s momentum indicators recently registered the fourth most bearish reading in the asset's history, a level of oversold intensity rarely seen outside of major cycle bottoms.
Localized Risk Premiums: Lenders are demanding significantly higher premiums from software entities, forcing a deleveraging event that spilled over into Bitcoin.
Structural Support Thresholds: The $IGV has plummeted to its critical 77 support zone, a level where historical data suggests a potential for stabilization.
This was not a failure of Bitcoin’s value proposition, but a collateral liquidation triggered by a sector-specific "tortazo" (slump).
4. Anatomy of Capitulation: Gamma, Futures, and the $58,000 Floor
Capitulation is a necessary market cleansing, a violent removal of "weak hands" and over-leveraged players to reset the volatility baseline. The recent drop was amplified by the mechanics of the futures market. High Open Interest combined with negative Gamma forced dealers to sell into the falling price to hedge their positions, creating a self-reinforcing volatility loop.
Technically, the market sought out established mathematical anchors. Bitcoin retraced precisely to the 0.618 Fibonacci level at 58,000** (measured from the October 2022 lows to the October 2025 peaks). Just below this sits the "Miner’s Floor" at **54,000. This represents the variable cost of production—primarily electricity. Below this level, miners lose money on every coin produced, creating a structural disincentive to sell that effectively hardens the floor.
The current sentiment—manifesting as panic regarding the solvency of major entities like MicroStrategy (MSTR) or miners—is a classic contrarian indicator of a market extreme. When the narrative shifts to bankruptcy and total collapse, the capitulation process is typically nearing completion.
5. The Road to Recovery: Building the "Time Base"
Following a liquidity shock of this magnitude, the market requires "time" rather than just "price" to heal. The structural damage is significant: the support line extending from the 2021 highs and the 2025 lows has been perforated. This level, roughly $79,000, has now transformed into a formidable "muro" (wall). This resistance must be reclaimed and held to restore the structural bull trend.
Strategically, investors should expect a lateral movement phase lasting two to three months as the market builds a new base. This delay is further influenced by a fundamental policy pivot under the "Bessent and Trump" administration, which prioritizes "Main Street" (the real economy) over "Wall Street." As liquidity is redirected toward real-world industrial and consumer sectors, the speculative "fiesta" in financial assets faces a temporary standby mode while the real economy absorbs the new capital flows.
6. Strategic Conclusion: Positioning for the New Cycle
Despite the current atmospheric "rain" in the markets, the long-term strategic thesis remains intact. Our internal 2026 cycle projections—recorded prior to this correction—have not changed. The current trend is not dead; it is in "standby."
For the mercenary strategist, the choice of vehicle is paramount. In this environment of high volatility and negative gamma loops, MicroStrategy (MSTR) offers a superior risk-reward profile compared to direct Bitcoin exposure. MSTR functions as a high-convexity play on the underlying, offering the potential for more aggressive captures of the eventual rebound once the $79,000 wall is breached.
The market is not witnessing an ending, but a necessary revision of the guest list. The resilient investor understands that while liquidity may shift its destination, the structural trend toward the 2026 cycle remains the dominant macro force.
