🔍 What is an imbalance zone?
Let's go 👇
Imbalance is an area on the chart where the price moved too quickly and without a pullback. Simply put, the market did not have time to 'digest' the movement, and there may be unfilled limit orders left there.
Such zones are often revisited for testing because:
there are unfilled orders left;
market makers can 'pick up liquidity';
this is a weak point in the structure that requires 'balance'.
💡 Such zones often attract the price back. These are key areas where pullbacks, reversals, or accumulation by large players can occur.
📊 Where to look and how to find?
Timeframes: 1H / 4H / 1D — ideal for identification and trading.
Signs:
2–3 candles in a row in one direction without a retest;
large candle bodies;
minimal or absent shadows;
after the zone — strong impulse.
✅ What to do when you find a zone?
Imbalance Down (price sharply decreased):
👉 We expect a return to the zone and look for confirmation for a short.Imbalance Up (price sharply increased):
👉 We wait for a retest from below and a possible long.
⚠️ Important:
Imbalance is not a signal to enter, but a zone of interest.
Works best in conjunction with:
level (support/resistance),
volumes,
market structure (HH/LL).
📌 Example: XRP 1D — analysis of imbalance zones
On the XRP chart, there are 3 key imbalance zones, and these are indeed strong areas:
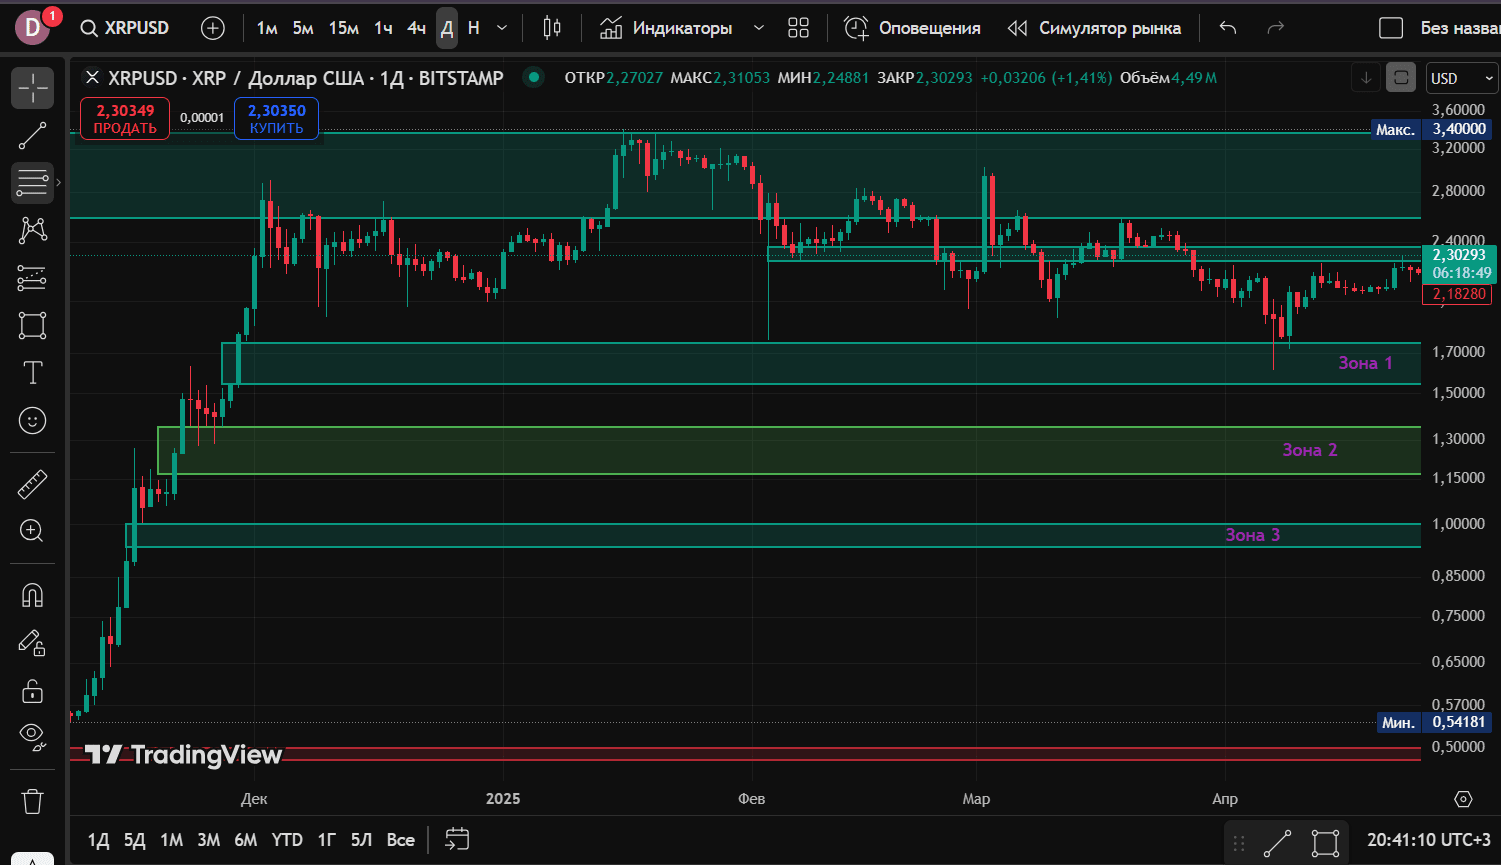
🟩 Zone 1 ($1.40–$1.65)
Sharp pump without a return.
Price broke out upwards in one or two candles.
Potential return zone during a correction after a rise.
🟩 Zone 2 ($1.12–$1.30)
Clearly expressed rapid breakout upwards, candle body not covered.
Imbalance formed on volume — an important demand level.
If the price returns — a bounce or consolidation before growth is possible.
🟩 Zone 3 ($0.93–$0.98)
The very bottom and previously marked — a base for a potential impulse.
Was formed at the beginning of the trend.
Has not been fully retested yet — which means it has chances to work.
🧠 How to use it in practice?
Looking for price return to the zone.
On lower timeframes (15m–1H), we wait for confirmation (pattern, volume, false breakout).
We enter in the direction of the impulse with a small stop behind the zone.
📈 Conclusion:
📌 Imbalance is a powerful reference point, especially on liquid coins like XRP. It shows where the price might stop or reverse.
🔧 Currently, relevant zones for XRP are:
$1.65
$1.30
$0.98
💬 If the market enters these zones again, entry points can be considered, especially with confirmation on lower timeframes.
🚫 This is not financial advice, but rather an opinion on the overall picture of the market and chart analysis. Always DYOR and consider your risks.

