We closed a complex week for BNB, characterized by a deep correction that has tested the nerves of traders. After losing the comfort zone of 900 USDT, the price has gone to seek "fuel" at lower levels. Is this the end of the trend or an opportunity for re-accumulation?
Here is the analysis of the data behind the movement.
📍 1. General Overview: The pressure from supply
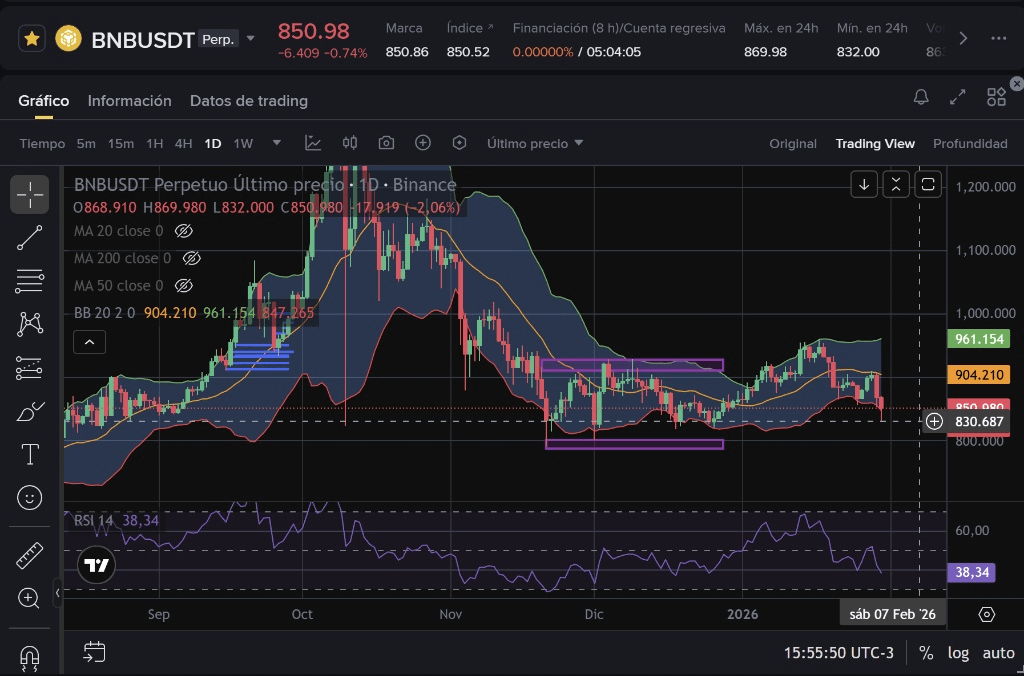
The week has been dominated by bears. If we look at the daily chart, we see how the price lost the dynamic support of the 50-period Moving Average (purple line) and has pierced the middle band of Bollinger.
However, the price does not drop into a void: it has stalled in the 830 - 850 USDT zone. This area is critical because it acts as a structural "floor" before the 200-period Moving Average (red line at ~790 USDT), which remains the final boundary of the macro bullish trend. We are in a bearish compression phase looking for a floor.
📍 2. Structure and Liquidity Reading (The reason for the drop)
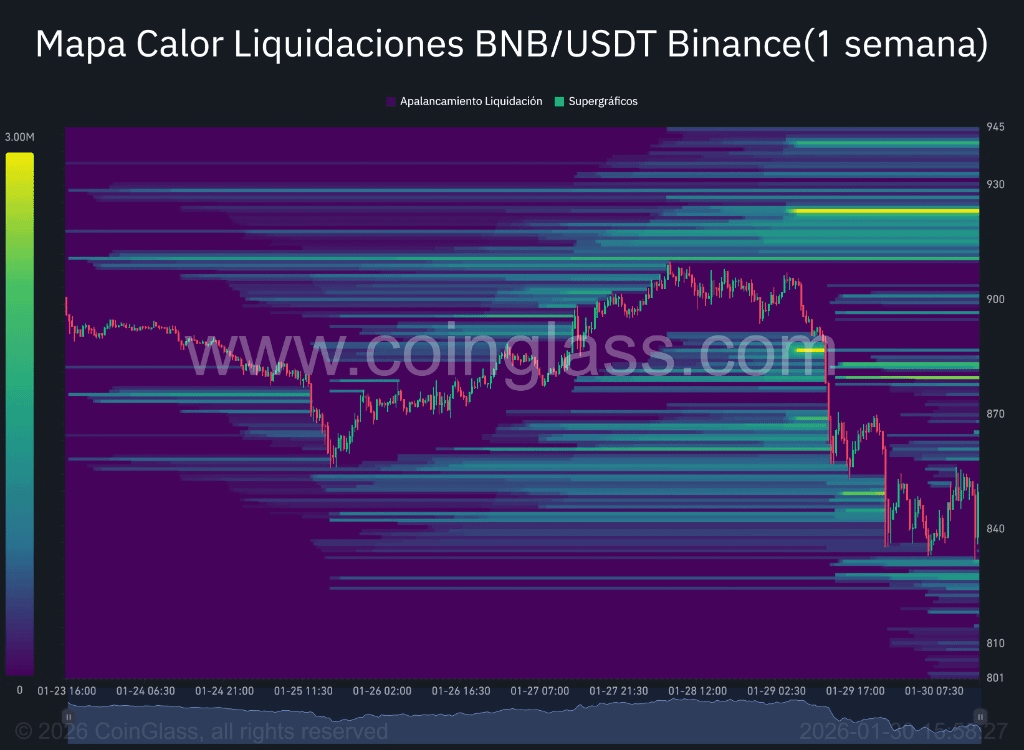
By crossing the price action with the Liquidation Heat Map, the movement makes logical sense:
Counterparty Search: The aggressive drop to 832 USDT was not a coincidence. The weekly heat map shows that a large number of Stop Loss and liquidation orders were accumulating right there (bright yellow lines that have now disappeared). The market "swept" that area to take out weak hands.
The new map: Once that bearish liquidity was taken, the map shows that the strongest interest blocks are now above the price, specifically between 880 and 900 USDT. If the support holds, the price could seek that upper liquidity by magnetic effect.
📍 3. Sentiment and Risk Management
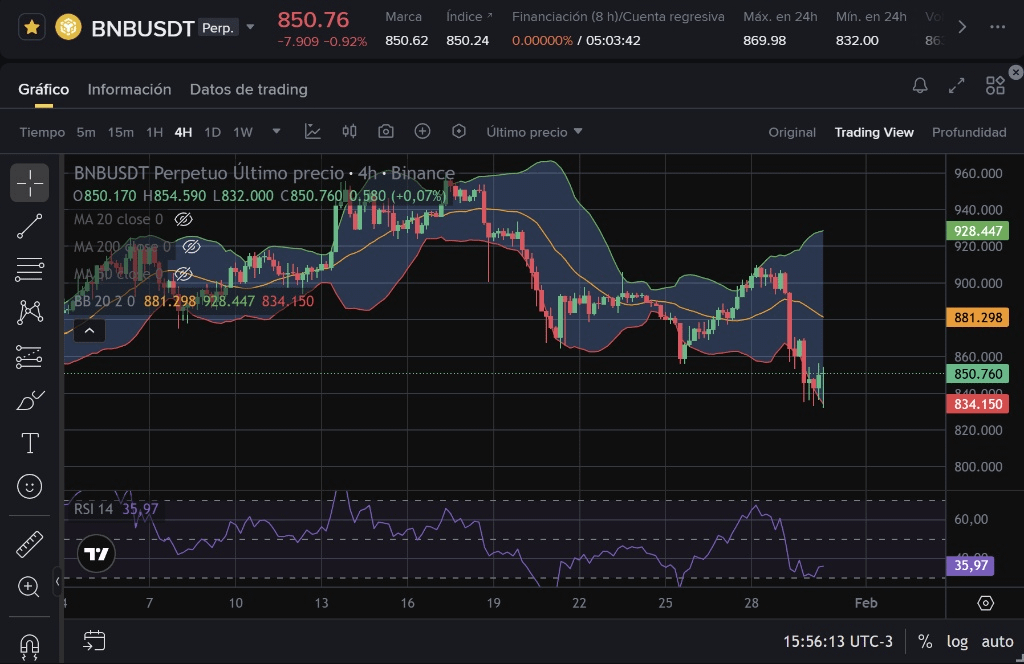
The RSI indicator on the 4-hour timeframe has entered oversold zones (near level 35). Historically, when the RSI touches these levels in a general bullish trend, it usually precedes technical bounces or pauses in the decline.
Price Action: Recent candles show "wicks" below (rejection of low prices), suggesting that there is absorption: someone with capital is buying what the market is selling in panic.
Management: The market is punishing anticipation. Trying to "catch the falling knife" is dangerous. Prudent management suggests waiting for the price to recover key levels (like 860 USDT) before assuming that the bottom is already in.
📍 4. Conclusion and Mindset
The technical verdict for the weekend is: Defensive Observation.
BNB is in a critical decision zone. It has cleared the board of leveraged long positions and now must prove whether it has the strength to bounce.
Status: Fragile in the short term, but at structural support.
Suggested approach: Patience. Don't trade out of fear of missing the bounce. Watch the reaction at 830 USDT; if they are lost with volume, a visit to the MA200 is likely. If they hold, we could see lateralization to build new momentum.
The content is informative and personal opinion based on technical analysis. It does not constitute financial advice. The crypto market involves risk. Do your own research (DYOR).
Seeing that the RSI is in oversold territory and has already swept the 832, do you think we will have a bounce this weekend or will we test the MA200 at 790? I'm reading you! 👇
#CryptoMarket #WeeklyReview #BNB #TradingAnalysis #BinanceSquare $BNB

❓ Closing question:
Seeing that the RSI is in oversold territory and has already swept the 832, do you think we will have a bounce this weekend or will we test the MA200 at 790? I'm reading you! 👇