
Navigating Market Turbulence: A Signal-Over-Noise Framework
Deciphering the Downturn
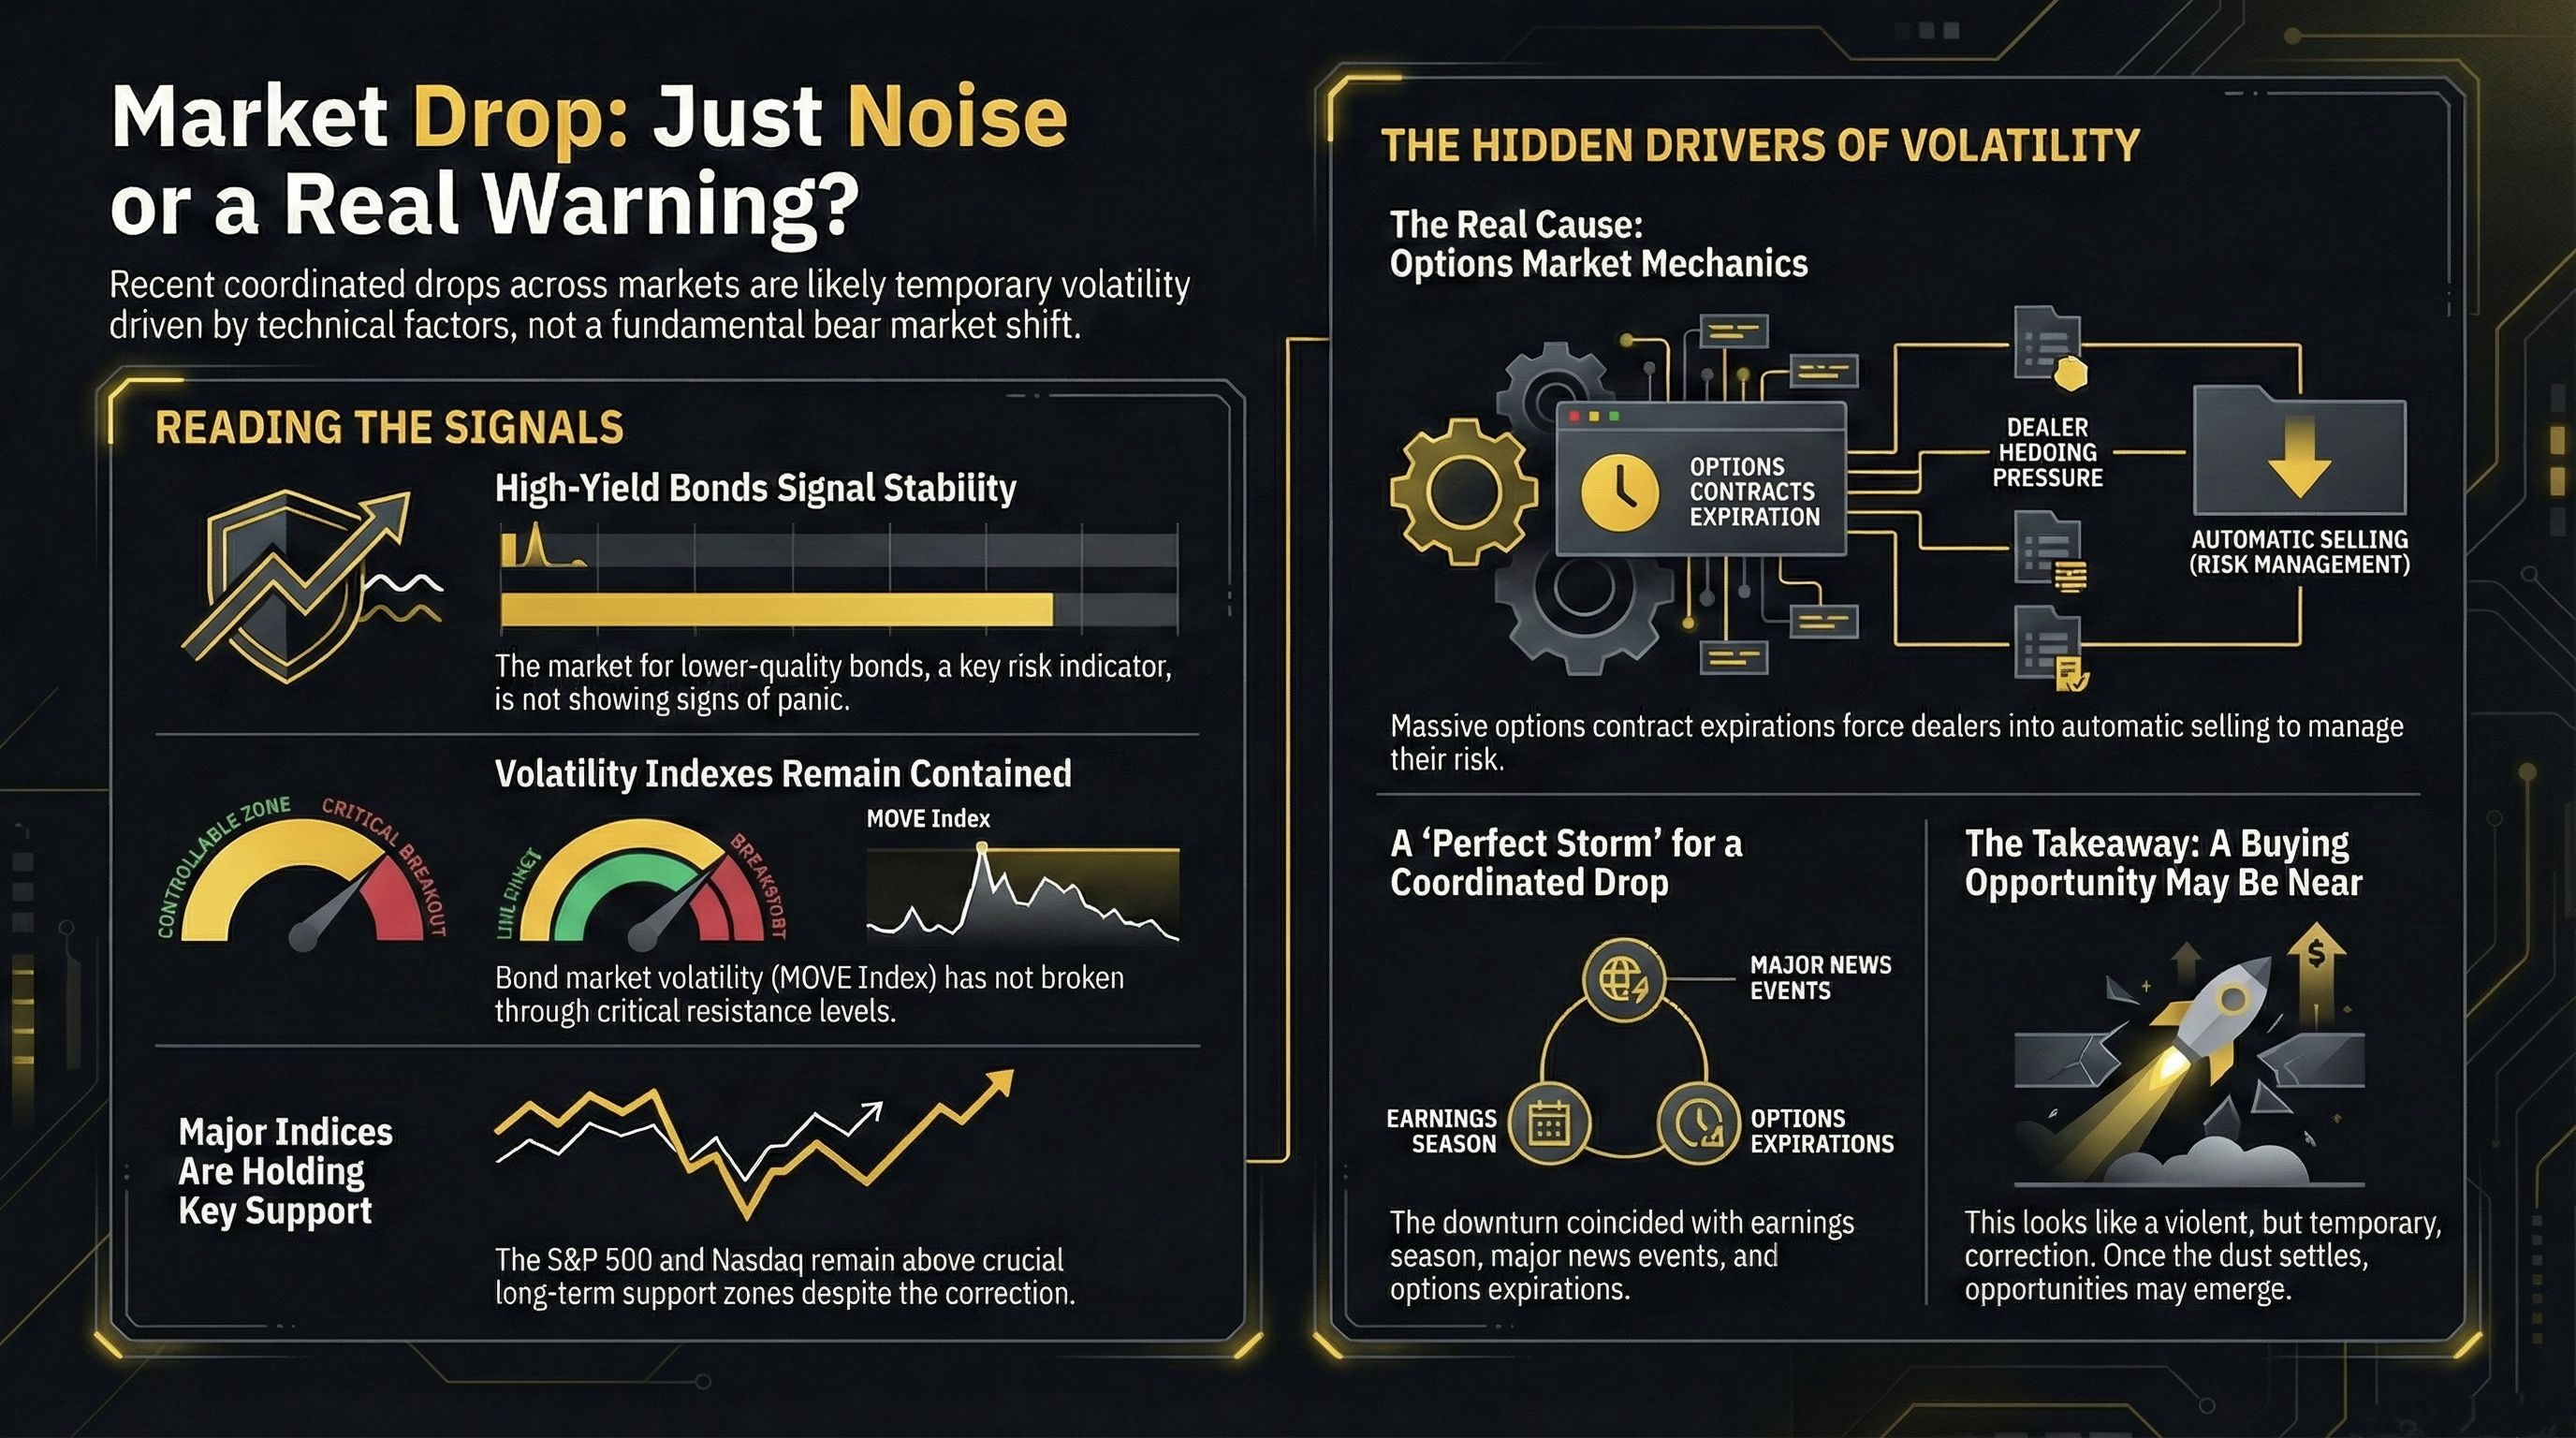
Recent market action has been characterized by a sharp, coordinated decline across major asset classes—from equities and cryptocurrencies to precious metals. This widespread drop has understandably fueled significant investor anxiety and raised a critical strategic question: Is this volatility the start of a sustained bearish trend, or is it transient "noise" that presents a potential opportunity?
This analysis provides a clear framework for distinguishing between fundamental market shifts and mechanical, short-term volatility. By examining underlying liquidity conditions, credit market signals, and the often-overlooked mechanics of options markets, we can cut through the alarming headlines and develop a coherent strategic perspective.
---------------------
1. The Macro Foundation: Why Liquidity Remains King
Before analyzing any price chart, a clear view of the liquidity environment is essential for forming a coherent market thesis. Liquidity is the fundamental bedrock of asset prices, and its overall trend provides the macro context for all market activity.
An analysis of the current environment reveals that while the rate of growth in liquidity may have slowed, the overarching trend of monetary expansion and degradation continues. From this foundational perspective, the conditions for a systemic, liquidity-driven bear market are not yet in place. With this macro backdrop established, we can turn to the more specific signals emanating from the credit markets to gauge the true level of systemic risk.

2. The Credit Market Canary: Gauging True Systemic Risk
Significant market downturns are almost always preceded by stress in the credit system. For this reason, credit markets—particularly high-yield or "junk" bonds—serve as a critical leading indicator of economic distress. If a genuine crisis were unfolding, these assets would be leading the decline.
A review of the key credit indicators reveals a state of calm, not crisis:
High-Yield Corporate Bonds: The price action in high-yield bonds shows a lateral consolidation within a broader uptrend. Crucially, the key support level in the 81 zone has not been breached. The absence of a sharp, sustained decline in this sector contradicts the narrative of an impending systemic event. Based on this indicator alone, the recent volatility is best classified as pure noise.
Bond Market Volatility (MOVE Index): The MOVE index, a key measure of volatility in the Treasury market, has not broken through the significant resistance level of 70, nor has it revisited the highs seen during previous periods of stress. This indicates a lack of systemic panic among sophisticated bond traders. This is pure noise.
Treasury Yields Deconstructed: It is crucial to distinguish between signal and noise within the Treasury market itself.
Short-term yield fluctuations, often tied to news events such as speculation about Federal Reserve appointments, should be treated as pure noise. The 2-year Treasury note remains in a lateral range, below key technical resistance at 3.65%.
The rise in 10-year yields is a more significant signal, but it is not one of panic. Instead, it reflects the market pricing in the risk of higher inflation in the second half of the year. Importantly, these yields remain below the critical technical resistance level of 4.3%.
The credit markets are not flashing the warning signs that would precede a major bear market. This suggests the source of the recent turbulence lies not in fundamental deterioration, but in the hidden mechanics that amplify price movements.
3. The Volatility Amplifier: Unmasking the Role of Options Markets
Market positioning is a major, often misunderstood, driver of price action. The hedging activities of large options dealers can create powerful price movements that are entirely independent of fundamental news, serving as a significant volatility amplifier. The key to understanding this dynamic lies in the concept of "gamma" exposure.
Positive Gamma Environment: In this state, dealers are a stabilizing force. As the market falls, their hedging activity requires them to buy the underlying asset. As it rises, they are required to sell. This behavior dampens volatility.
Negative Gamma Environment: This is a destabilizing state. When dealers have negative gamma exposure, they become trend-followers. As the market falls, their hedging activity forces them to sell into weakness. As it rises, they are forced to buy into strength. This dynamic exaggerates price swings in both directions, creating sharp, violent moves.
The recent market action can be directly linked to this mechanical effect. The coordinated, rapid sell-off across all asset classes coincided with a period of significant options contract expirations and a shift into a negative gamma environment. This created a perfect storm for amplified, technically-driven selling, explaining the severe character of the recent drop.
4. Asset-Specific Analysis: Applying the Framework
Applying this framework of liquidity, credit signals, and options mechanics allows us to interpret the recent price action in specific asset classes with greater clarity.
Equity Indices (S&P 500 & Nasdaq)
The recent decline in major equity indices is best characterized as a technical correction, with price moving from the top of an established upward channel to the bottom. Primary support remains intact, specifically within the 6,825-6,800 zone for the S&P 500. The sharpness of the sell-off was not driven by a fundamental shift in outlook, but rather by the negative gamma effect, where breaks of minor support levels triggered automated dealer hedging and accelerated the move downward.
Bitcoin
The digital asset has been in an extended period of consolidation between 80,000 and 95,000, leading to significant investor exhaustion. The current environment is defined by extreme fear and capitulation in positioning; those who intended to sell have likely already done so. The options market structure, particularly negative gamma exposure, is currently defining the asset's volatility within this wide range rather than signaling a new, definitive downtrend.
Gold and Silver
The recent violent drop in precious metals was not a bearish reversal but a technical washout of an extremely over-extended and over-bullish sentiment. The monthly RSI, a key momentum indicator, had reached its highest level in 50 years, making the market exceptionally vulnerable to a correction. This price action represents a sharp return to the key technical breakout level of 5000, suggesting this may be a corrective buying opportunity rather than a reason for systemic panic.
Across all these asset classes, the evidence points more toward technical corrections, sentiment washouts, and mechanically-amplified volatility than a fundamental breakdown.
-------------------------
5. Conclusion: A Strategic Perspective for What Comes Next
Synthesizing the evidence, the recent market turbulence is best understood as noise—driven by options mechanics, sentiment extremes, and technical corrections—occurring within a still-supportive macro liquidity environment. The core signals of market health, particularly in the credit markets, remain stable.
In the current environment, the key to successful navigation is to focus on signal over noise. This requires monitoring the true health indicators of liquidity and credit while understanding that short-term volatility will be amplified by market positioning effects. These corrective phases, while unsettling, are a normal feature of bull markets. For the disciplined investor who can look past the short-term noise and focus on the underlying structural integrity of the market, they can offer valuable opportunities.

