
$AXS has had an outstanding performance with a 225% increase in just three weeks along with record-breaking trading volume. However, the chart is sending out major warning signals despite the excitement, a 30% correction is lurking.
Click here: Get 30% cashback on transaction fees at Binance Wallet/Web3
Click here: Get Permanent 20% Fee Rebate on SPOT & Futures
🔹 Price Trap
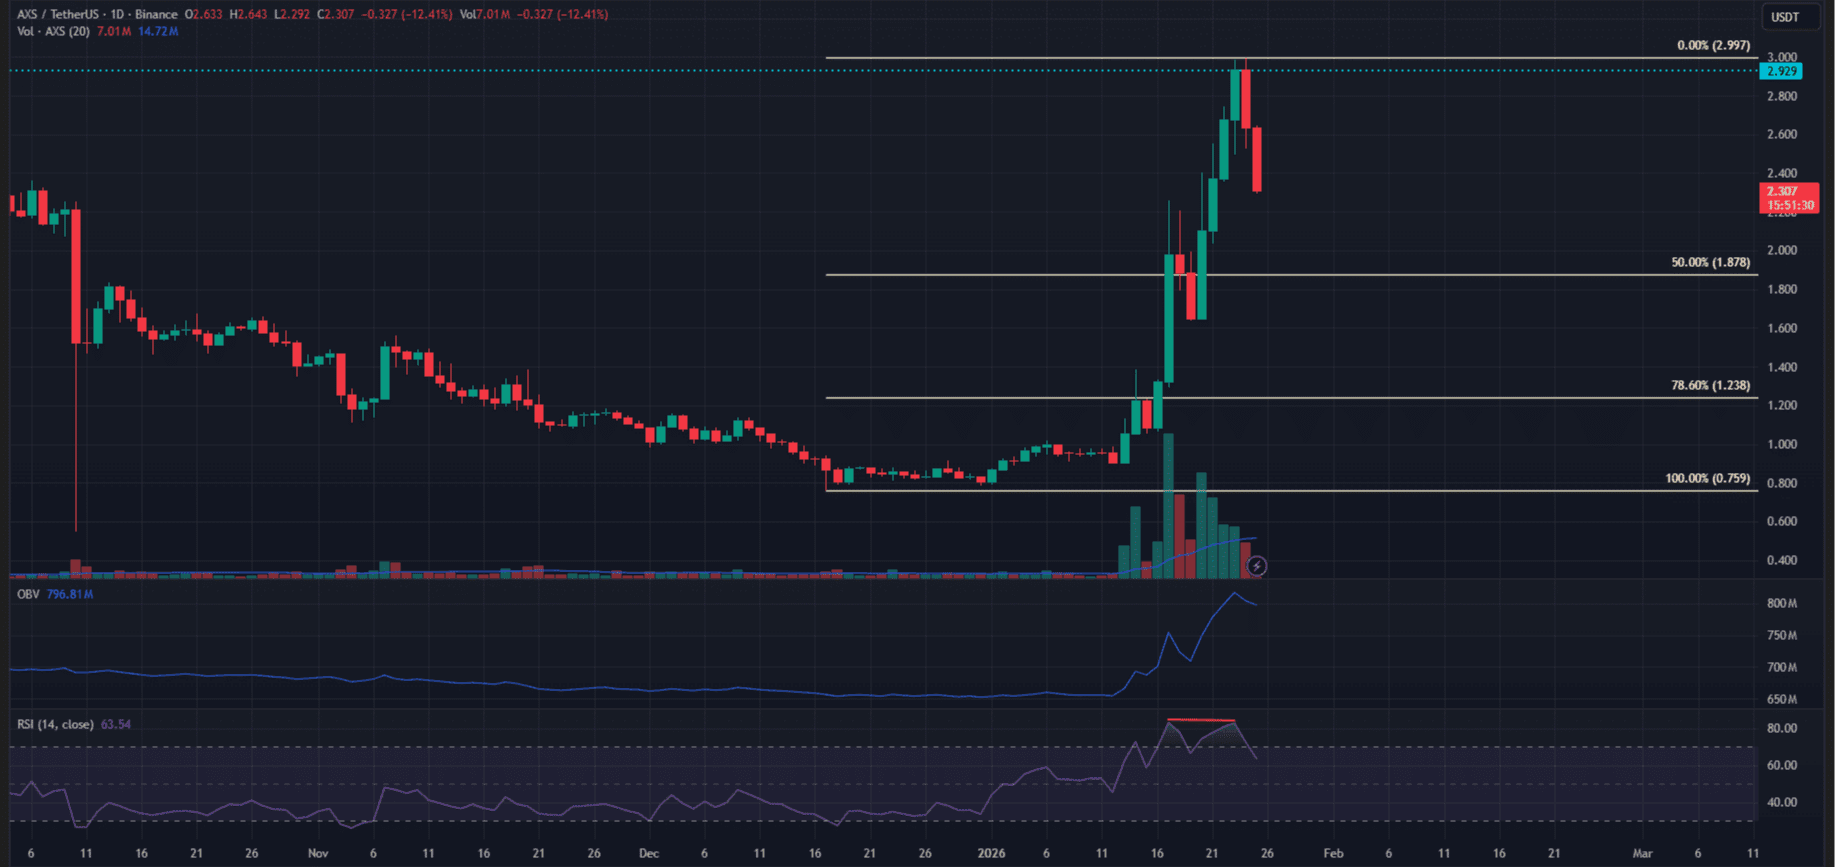
This week's volume is extremely high, pushing the OBV indicator to levels not seen since 2024. The weekly RSI has exceeded 50 for the first time in over a year.
Despite a 10.79% increase over the week, AXS has failed to close the weekly candle above the important old high of $2.92. The price rejection at the long-term resistance ceiling of $2.92 - $3.00 is a typical fakeout.
🔸 Technical Breakdown
On the daily chart, RSI is showing a bearish divergence compared to the price, indicating that momentum has exhausted.
With BTC trading below $90k, the macro context supports a deeper correction for altcoins.
The 15% drop from the $3 mark has begun, but the technicals suggest it is not over yet.
🔹 Waiting for the Correction The rejection at $2.92 confirms the short-term peak.
Traders should prepare for the possibility of the price dropping to the Fibonacci level of $1.878.
The ideal entry point for swing traders is between $1.238 and $1.878.
Do not buy until AXS reclaims the $3.00 mark or retraces to the $1.3 - $1.8 zone.
AXS has pumped 225% but failed to break $2.92. Are you chasing after "record volume," or are you placing a limit order at $1.80 for the inevitable reset?
News and research information from Trading Insight is for reference only and is not investment advice. Please read carefully before making decisions.

