
$BTC is trading at $88,870 after being rejected in the $97k range. Although the chart looks weak, on-chain indicators show signs of selling exhaustion, opening up opportunities for buyers to regain control.
Click here: Get a 30% refund on transaction fees at Binance Wallet/Web3
Click here: Permanent 20% refund on SPOT & Futures
🔹 Signal
This index has improved to -0.0009, indicating that selling pressure is easing. Sellers are getting tired and buyers are becoming more aggressive.
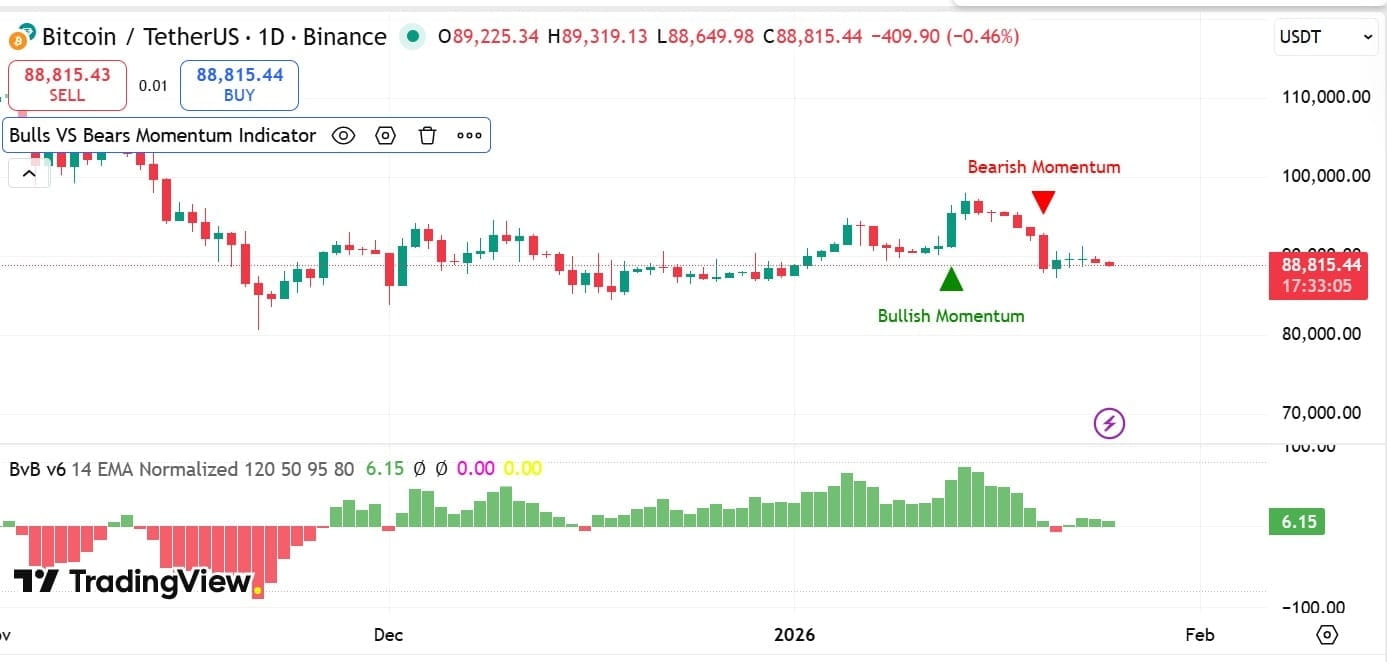
The BvB EMA has normalized to 6.19, maintaining a positive state for 4 consecutive days. This is a positive shift compared to the strong sell-off when BTC broke below $90k earlier.
🔸 Battlefield
Spot Taker CVD data from CryptoQuant has maintained positive levels for the past 7 days.
Huge buy orders are piling up at $89k. The buyers are building a wall of support here with the goal of turning $90k back into support.
🔹 Signal Conflict is at a critical decision point.
If the $89k wall holds and momentum is maintained, the Future Grand Trend indicator signals a bounce targeting $93k.
The SMII indicator has formed a bearish crossover, signaling a strong bearish trend. If the sellers break through the $89k front line, BTC risks dropping to $86,270.
On-chain data indicates a Wall of Support at $89k, but the technicals (SMII) are shouting a bearish trend. Are you betting on a bounce due to exhaustion up to $93k, or a technical drop back to $86k?
News and research information from Trading Insight is for reference only and is not investment advice. Please read carefully before making a decision.
