
Let's visit some of the bigger projects to see what they have to say. Here, Dogecoin has been in decline for six days, or two weeks if we count since January 5... I was looking at the daily chart.
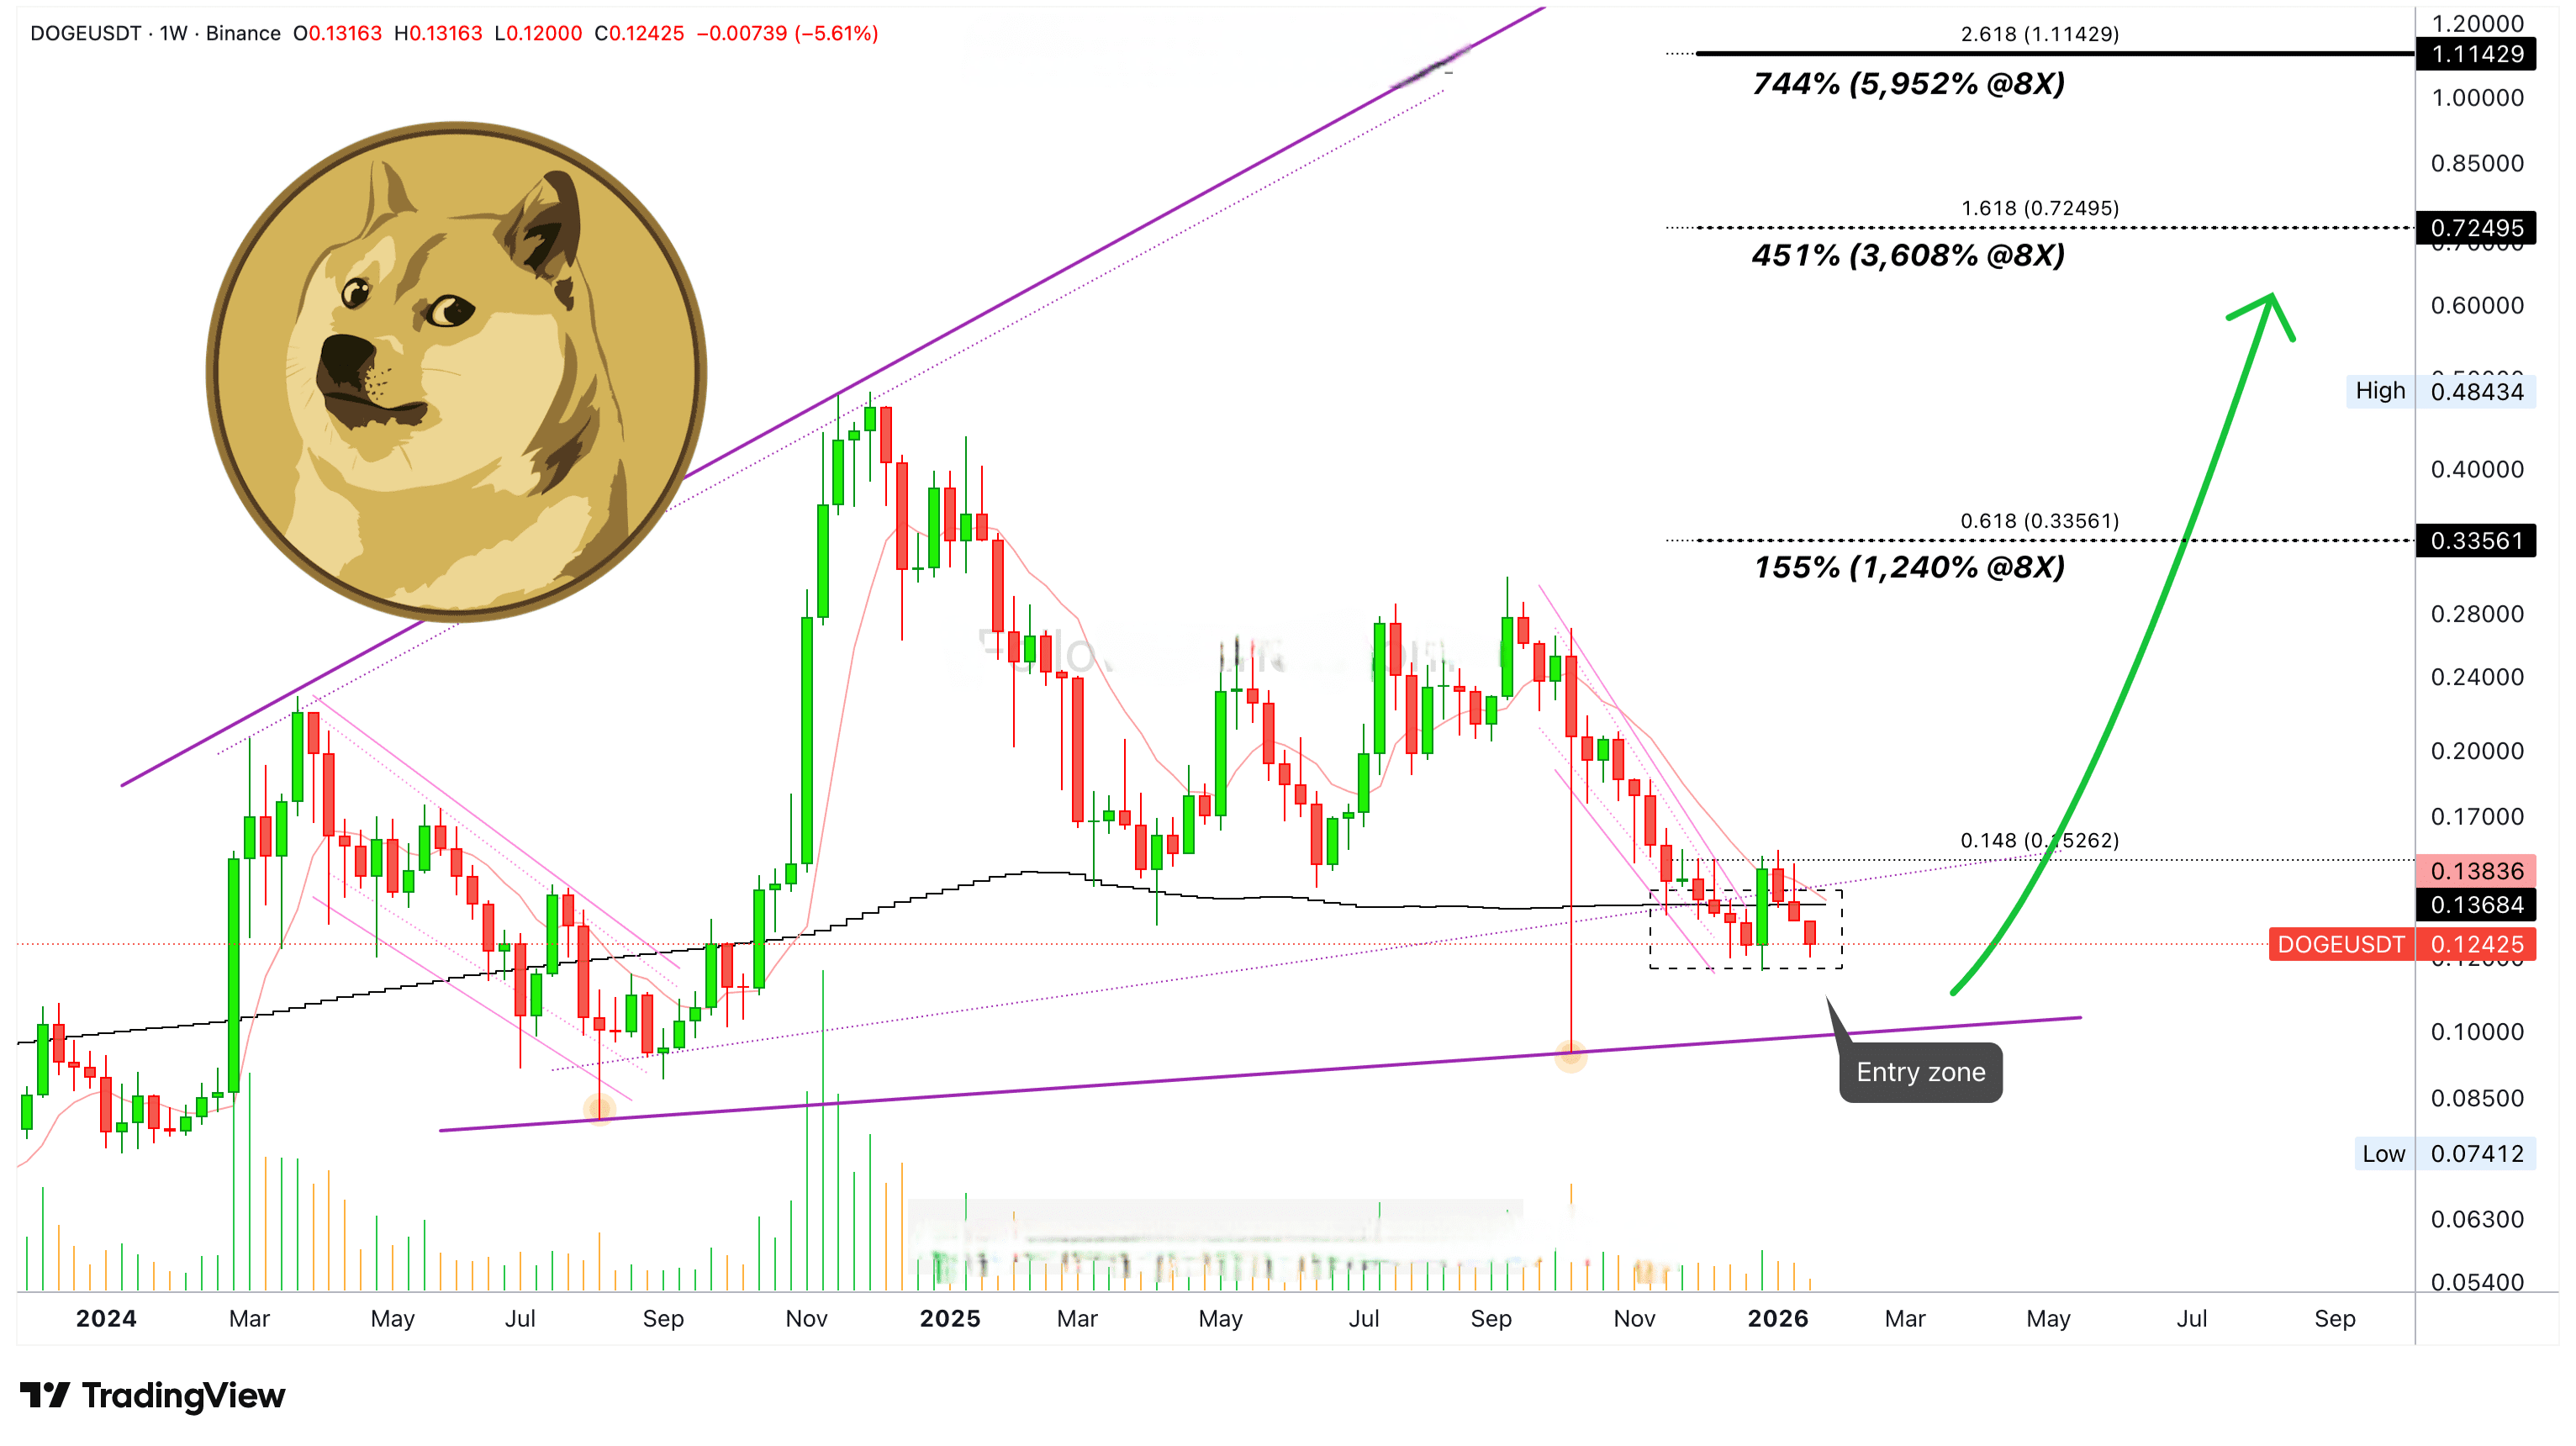
Here we have the weekly timeframe and two weeks have already closed in red and the third week, current, starts in red. The price has returned below MA200. There is only one green week to indicate the end of the bearish trend and the price has returned to our entry zone.
There are several points to consider here: Dogecoin has been trading within the same range, side by side, since November 17. Any new declines cannot be considered a positive signal; the bottoming process is still ongoing.
This week is still lower compared to the end of December when the movement crossed above MA200.
How can we approach these charts?
An upward wave follows a downward wave, that’s for sure. But here it can get complicated, there could be another shakeout, and a final rush before prices start to rise. So be cautious when using too much leverage.
Spot trading is 100% safe and this is a great price and entry range. Here, you can accumulate as much as possible. If prices drop, buy more.
It could happen that Dogecoin turns bullish this very week. There could be a wick, like August 2024, or an immediate reversal could occur where there is no bearish volume - buy and hold.
Look here at the complete trading numbers. Be careful with the wick of liquidation. Patience is key. When in doubt, secure your position.
Hello.
✅ Trade here on $DOGE