Dogecoin may be forming a descending wedge
Recently, Dogecoin (#DOGE ) may be trading within a descending wedge pattern. Technical analyst Ali Martinez shared this observation on the X platform, noting that if DOGE can break through this pattern, it could usher in a strong upward trend. The wedge is a classic pattern in technical analysis that forms when prices fluctuate between two converging trendlines, helping investors identify potential breakout directions.

A descending wedge typically signals a trend reversal or continuation, depending on the price action prior to its formation. In an uptrend, a descending wedge is often seen as a continuation pattern; whereas in a downtrend, it may indicate a trend reversal. Martinez pointed out that this descending wedge for Dogecoin has been influencing price movements over the past year, with recent prices pulling back to the lower trendline, indicating that the support level is being retested.
What is a descending wedge?
The descending wedge is similar to a triangular channel, but there is a key difference: the slopes of the two trend lines of the wedge are in the same direction, while the triangular channel has either one horizontal trend line or opposite slope directions. When the price fluctuates along the descending wedge, the upper boundary usually constitutes resistance, while the lower boundary acts as support. A breakout from either boundary may signal the direction of the next trend.
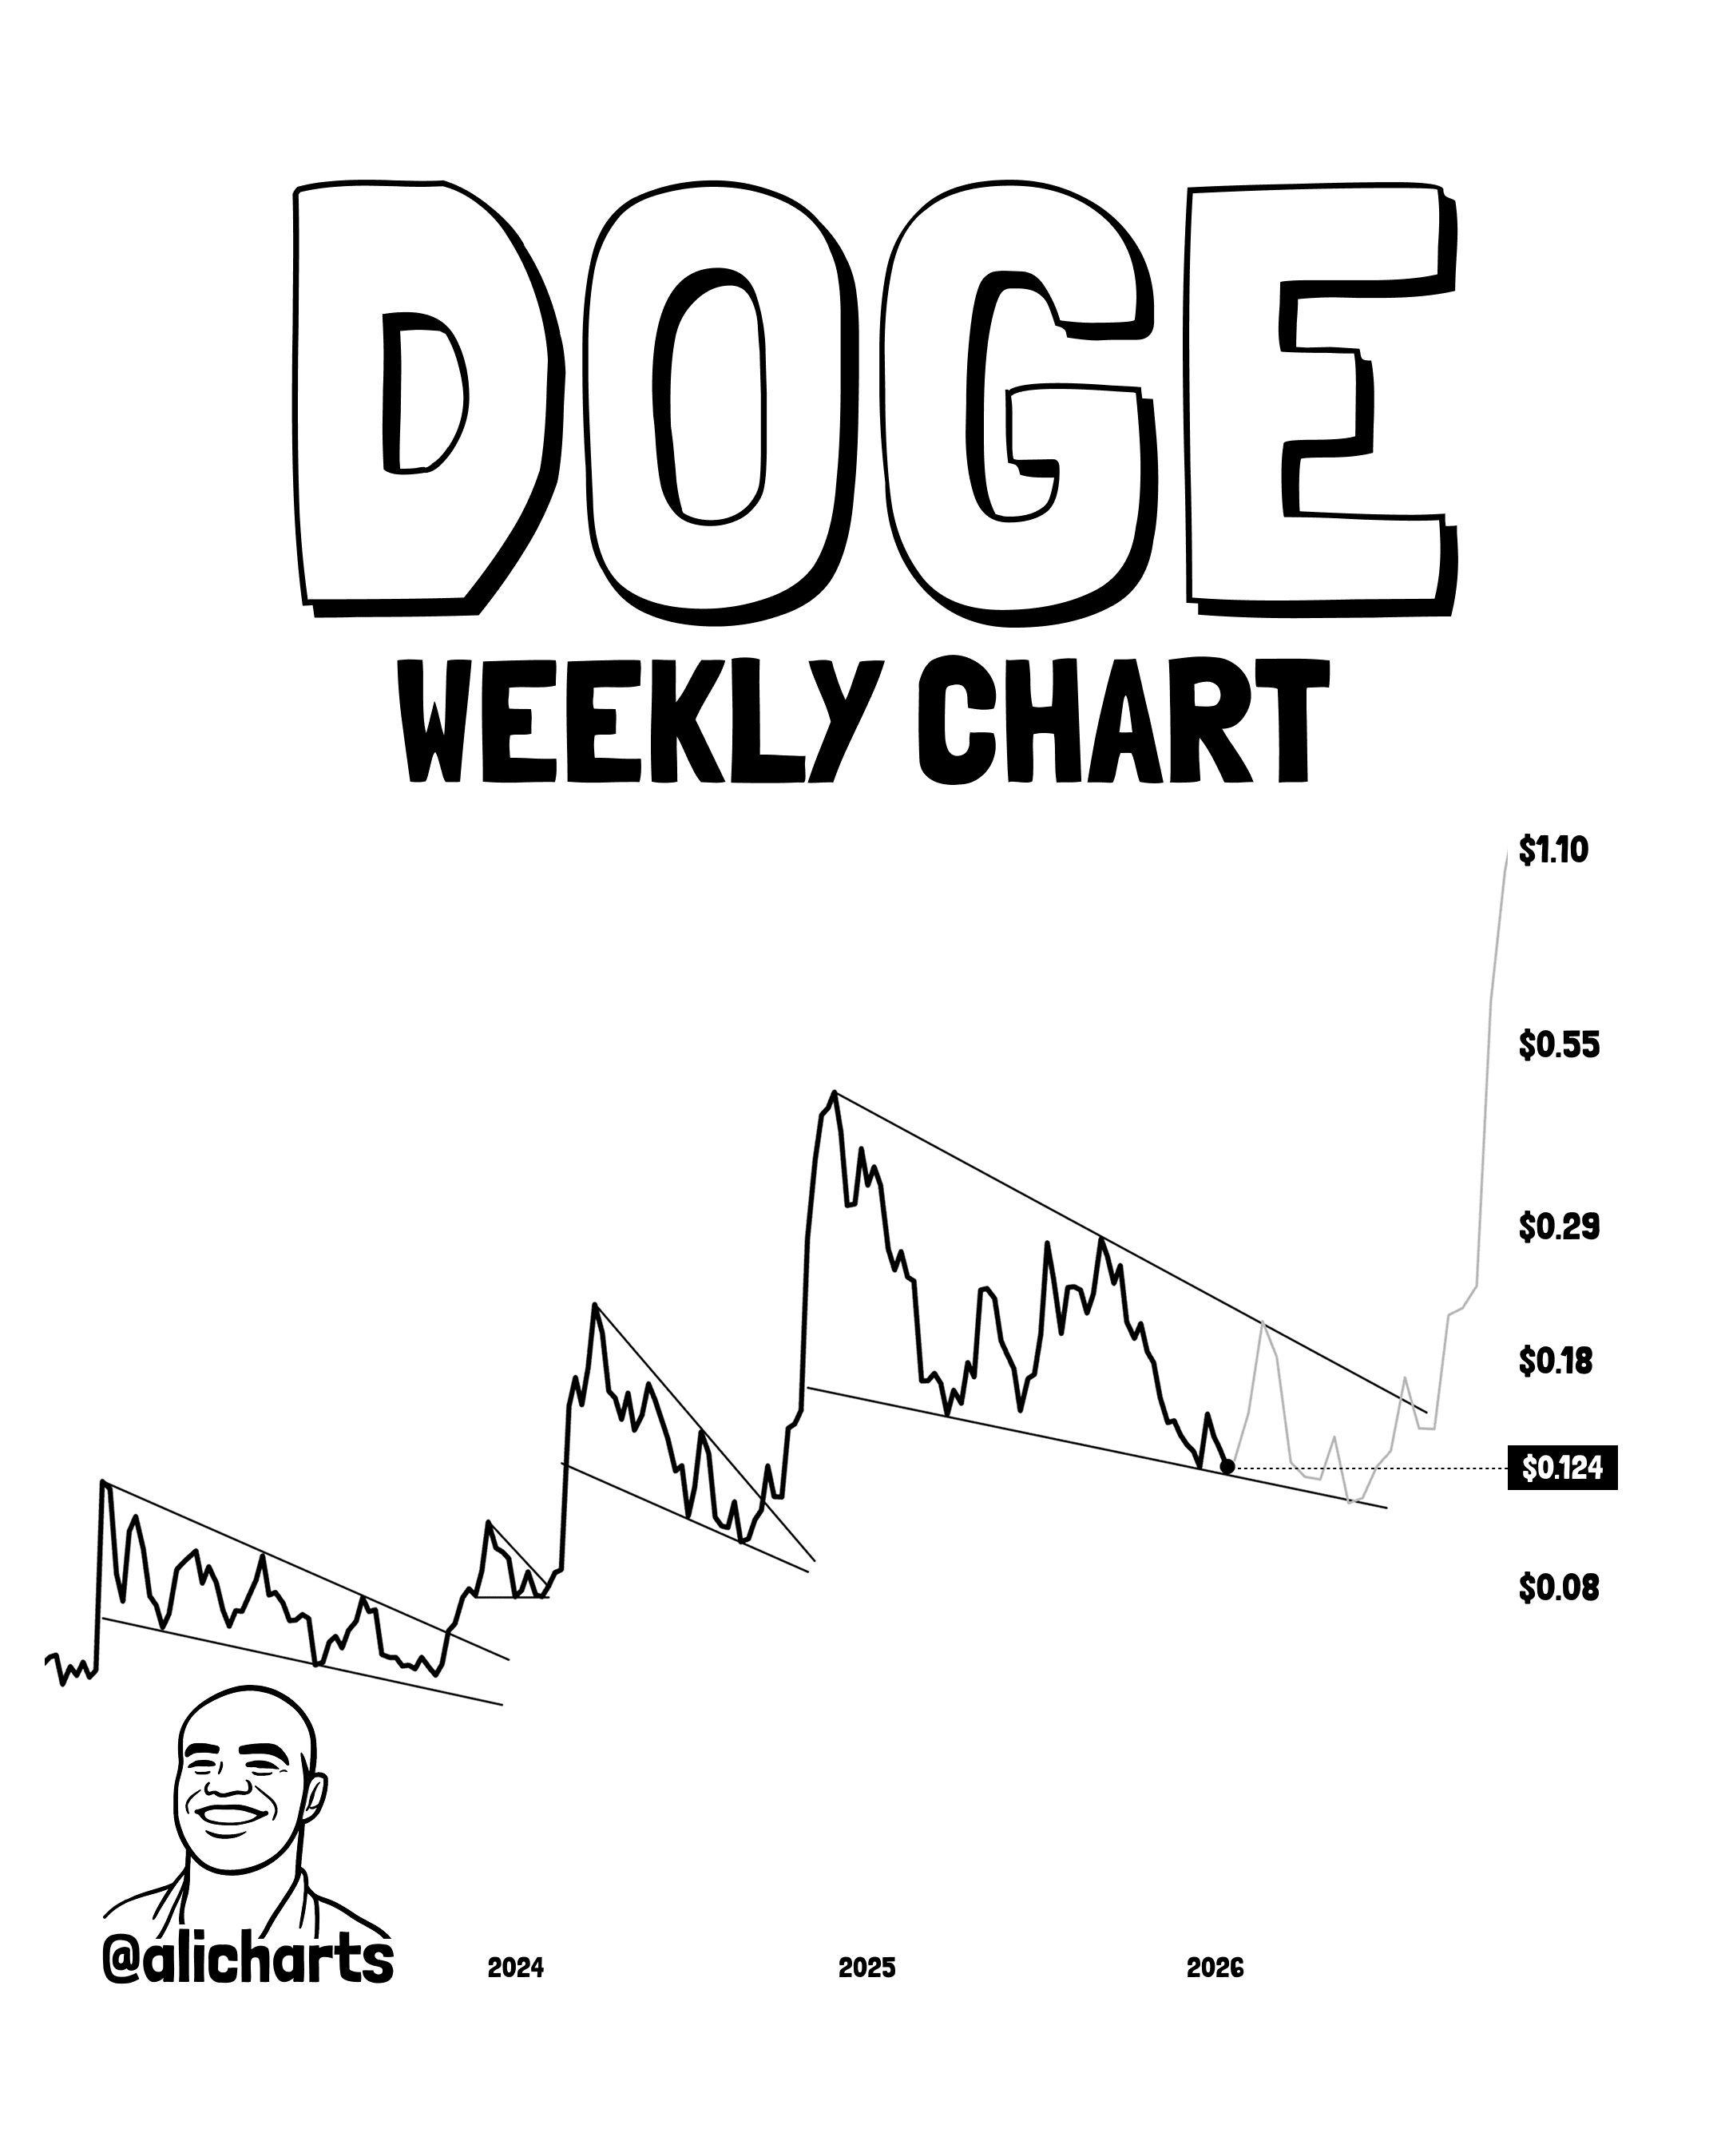
Historically, Dogecoin's descending wedges have often developed into bullish continuation patterns, ultimately breaking out upwards. Martinez points out that the current wedge is the widest one in the past few years, so its potential breakout strength may also be stronger. This means that once the price breaks above the upper boundary, DOGE may experience a significant upward surge.
Is the support level of DOGE stable?
The key question at the moment is whether the lower boundary of the descending wedge can hold. If the support is solid, there is a chance for the price to rebound along the upper boundary of the wedge and challenge the resistance level. Martinez marked several past descending wedges of Dogecoin on the chart, each of which eventually evolved into a bullish continuation. Considering the recent price trend, the market seems to be accumulating energy, waiting for a breakout opportunity.
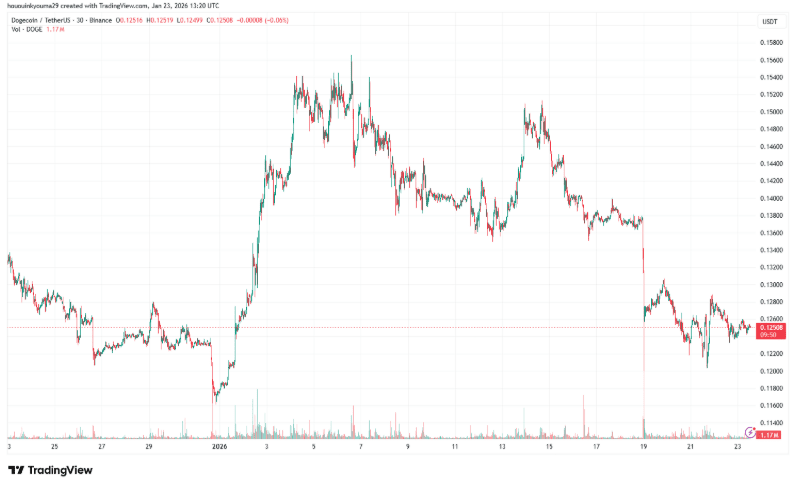
On the other hand, if the support fails to hold, the price may continue to decline, and the short-term trend still needs to be observed with caution. This is also a common risk point in technical analysis: the wedge pattern provides a potential directional signal, but the testing period before the breakout may be accompanied by fluctuations.
Conclusion: Is a breakout imminent?
In summary, the descending wedge that Dogecoin is currently experiencing provides a technical opportunity worth paying attention to. Historical data indicates that DOGE usually trends bullishly under similar patterns, so the potential for breaking above the upper boundary is worth anticipating. The key lies in whether the support line can hold and when the price can effectively break through. For investors, closely monitoring the weekly chart and wedge boundaries is an important reference for judging the next market movement.
Overall, the width and historical performance of Dogecoin's current descending wedge suggest that once it breaks out in the future, a fairly strong upward trend may occur. The market is quietly waiting for signals, and DOGE's next movement may become the focus of investors.
