When traders describe VANRY/USD as “bearish,” they’re usually reacting to the surface-level signals. On paper, the technical outlook does look weak. The daily buy/sell summary points to a Strong Sell, driven almost entirely by moving averages that remain stacked against price. But technical analysis becomes more useful when we stop reading indicators in isolation and start asking why the market looks the way it does.
The most dominant factor right now is trend alignment. From the 5-day through the 200-day moving averages, VANRY sits in an unfavorable position. With zero buy signals and twelve sell signals across this range, the message is simple: the broader market still views VANRY as being below its fair trend value. This doesn’t mean panic selling is underway; it means price has failed to reclaim structural levels that long-term participants care about. The market is cautious, not emotional.
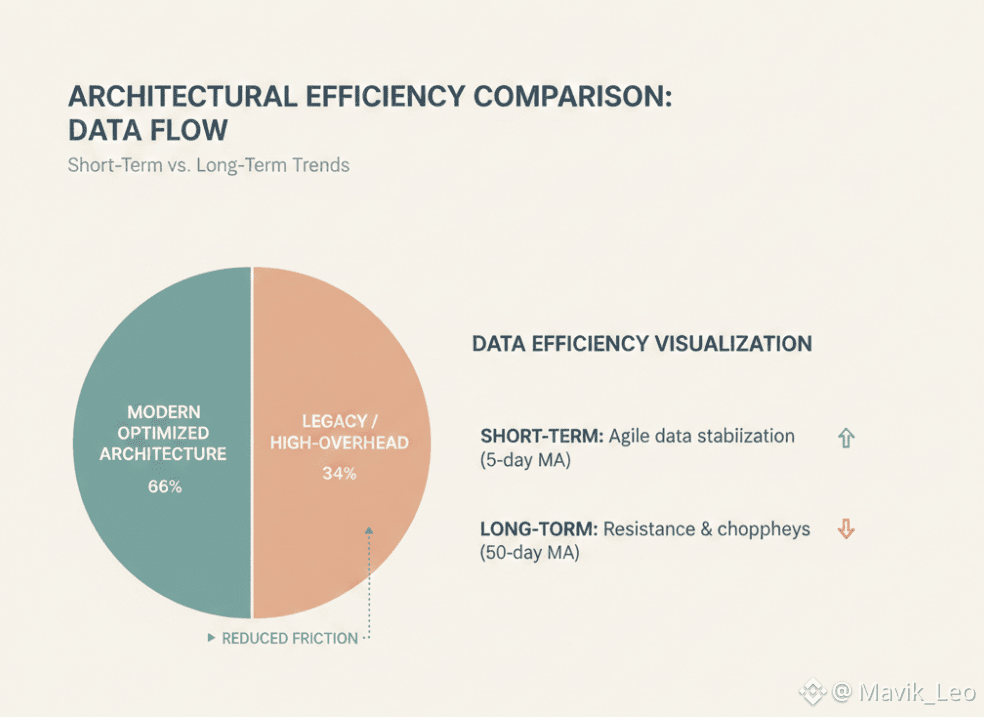
Interestingly, the short-term picture slightly diverges from the bigger trend. The 5-day moving average at 0.00639 shows a minor buy signal, suggesting short-term traders are attempting to stabilize price. However, this effort runs directly into the 50-day moving average at 0.00646, which remains a sell signal and acts as overhead resistance. This type of setup often leads to choppy price action, where small rallies are sold into rather than expanded.
Momentum indicators reinforce this idea of balance rather than breakdown. The 14-day RSI at 49.3 sits almost perfectly neutral. This tells us VANRY is neither oversold nor overheated. If sellers were truly in control, RSI would be slipping toward the low 40s or below. Likewise, the MACD reading at 0.000 reflects a complete flattening of momentum. Directional conviction is absent. The market is waiting.
 That waiting zone becomes clearer when we look at the Fibonacci pivot point at 0.00653. This level represents a technical decision area. As long as price remains below it, rallies are viewed as corrective. A clean break and hold above it would shift the conversation from “sell pressure” to “trend repair.”
For a project like Vanar Chain, this technical posture often appears during accumulation phases rather than distribution. The chart suggests compression, not capitulation. VANRY is being priced cautiously while traders demand confirmation.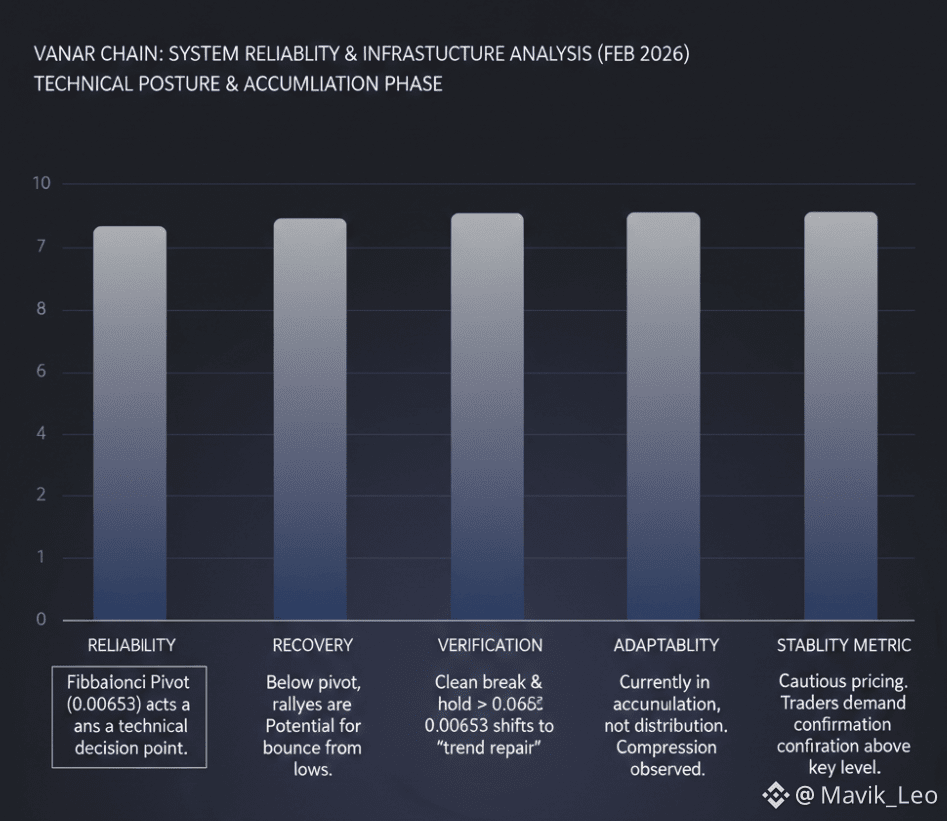
In summary, VANRY/USD is technically bearish by trend definitions, but structurally neutral in momentum. Until price reclaims key moving averages and holds above the pivot zone, sellers control the narrative. Yet the absence of strong downside momentum suggests this is a market pausing, not breaking.
