
The XLM correction deepens and slips to its lowest level in three months amid ongoing risk aversion.

The Stellar price drops below $0.20 on Friday, reaching its lowest level since October 11.
The derivatives market supports bearish sentiment, with open interest declining and negative funding rates.
Technical forecasts indicate further correction as momentum continues to weaken.
Stellar ($XLM ) continues to trade in the red, having dropped below $0.20 on Friday, a level not seen since mid-October. Bearish sentiment is rising amid declining open interest (OI) and negative funding rates in the derivatives market. Technically, weak momentum indicators support further correction in XLM.
XLM derivatives data shows a bearish bias
Derivatives data for Stellar supports a bearish outlook. Weighted funding rate data based on open interest from CoinGlass shows that the number of traders betting on a decline in XLM's price is greater than those expecting a price increase. The gauge turned negative on Thursday and stands at -0.0049% on Friday, indicating that short positions are paying long positions and suggesting bearish sentiment towards XLM.
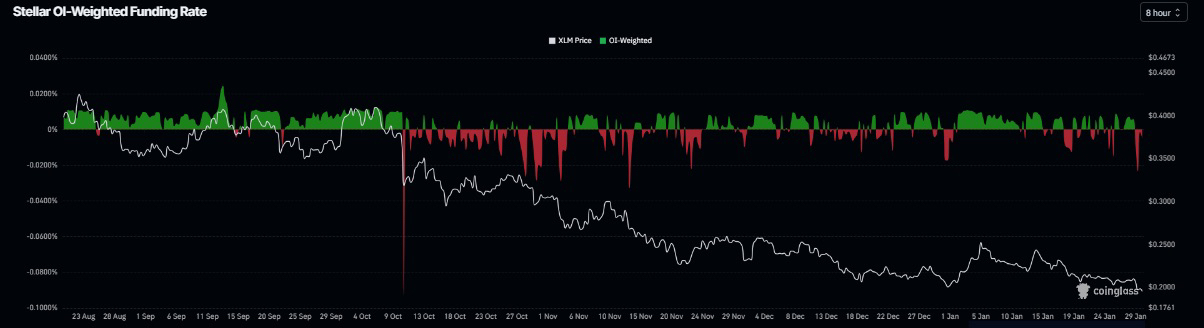
Stellar funding rates chart. Source: CoinGlass
Open interest in $XLM futures fell to $106.50 million on Friday and has consistently declined since its peak of $166.99 million on January 6. This decline in open interest reflects a decrease in investor participation and indicates a bearish outlook.
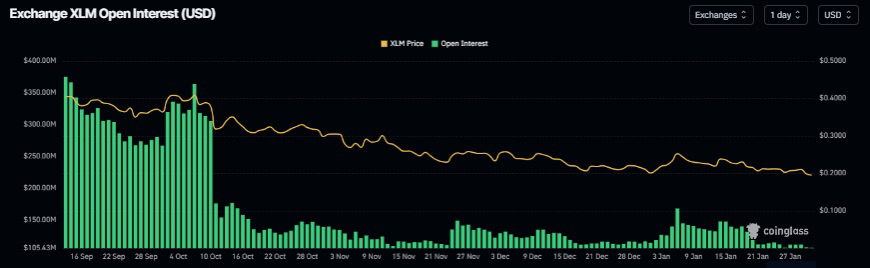
XLM open interest chart. Source: CoinGlass
Stellar price predictions: Bears dominate XLM
The price of Stellar closed below the weekly resistance level of $0.22 on January 18 and has decreased by about 9% over the following two weeks. As of this report on Friday, XLM is trading at $0.19, a level not seen since October 11.
If $XLM continues to correct, the decline may extend towards the yearly low of $0.16, which was established on October 10.
The Relative Strength Index (RSI) on the daily chart is at 35, below the neutral level of 50, indicating that bearish momentum is gaining strength. Moreover, the Moving Average Convergence Divergence (MACD) showed a bearish crossover on January 18, which is still in effect as the red histogram bars remain below the neutral level, further supporting the negative outlook.
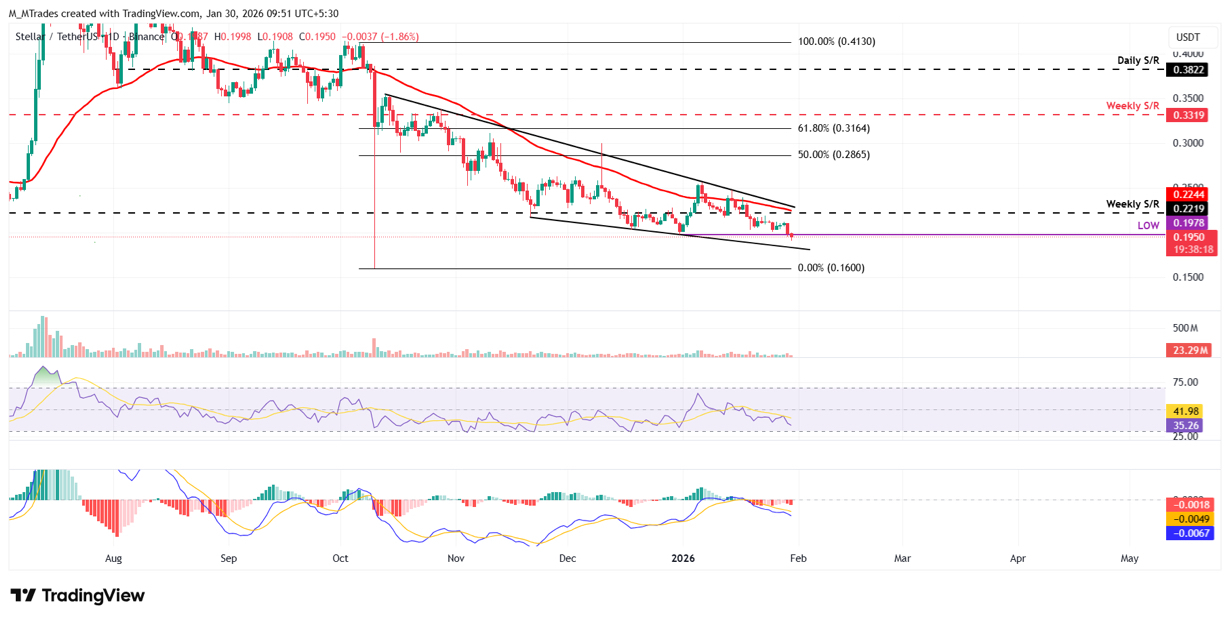
Daily chart of XLM/USDT
On the other hand, if XLM recovers, the rally may extend towards the weekly resistance level at $0.22.
#XLM #xlm #BinanceSquareFamily #BinanceSquare #BinanceSquareTalks