

Dash continues to decline below the 50-day exponential moving average, exposing it to a drop to 50 dollars.
Privacy coins are the worst performers in the sector over the past month, indicating a shift in sectoral capital.
A decrease in open interest and a liquidation of over 1,000,000 dollars in long positions indicate a clear bearish bias.
Dash ($DASH ) is facing strong headwinds, having recorded a 3% decline at the time of writing on Thursday, extending the broader decline over the past two weeks which places the 50-day Exponential Moving Average (EMA) at $55.93 in the spotlight. The drop in demand for privacy coins has made these tokens the worst asset class in the cryptocurrency market over the past month. In the case of Dash, the double-digit capital flows observed in the derivatives market due to a significant liquidation of long positions indicate a decrease in investor interest.
Demand has shifted from privacy coins
Artemis data shows that privacy coins are among the most affected sectors in the cryptocurrency market, having recorded a decline of over 13% over the past month. This downturn indicates a slowdown after the massive surge in late 2025 and early this month.
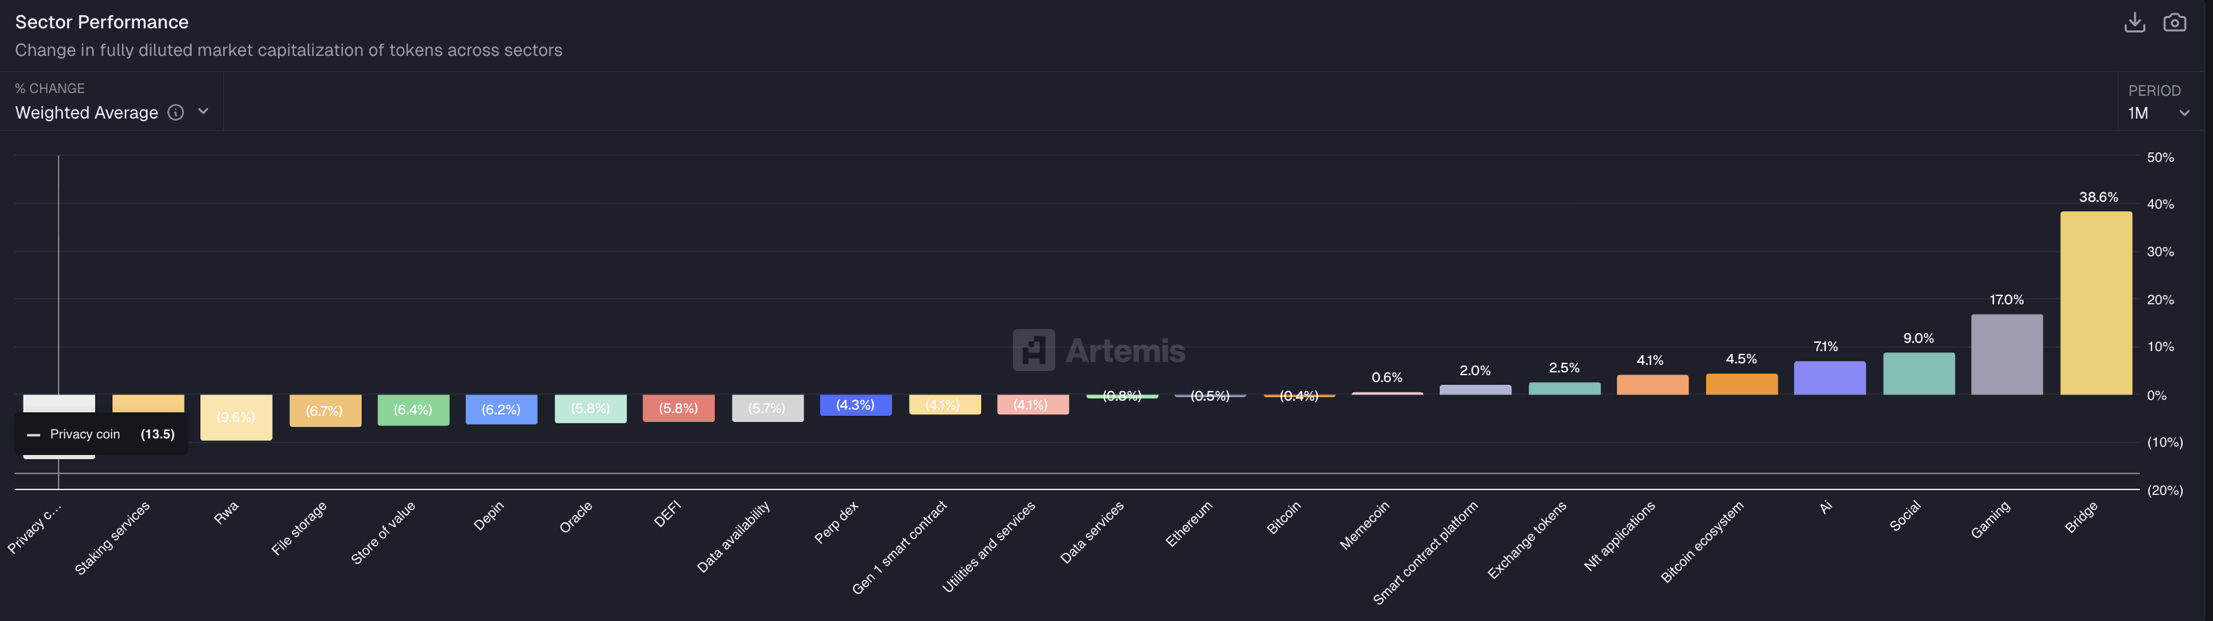
Sector performance data. Source: Artemis
On the derivatives side, open interest in Dash futures contracts (OI) has decreased by 13.69% over the past 24 hours to $105.31 million, indicating capital flows primarily driven by the liquidation of long positions and risk-averse sentiment. The liquidation of long positions over the past 24 hours amounted to $1.19 million, surpassing the short position liquidation of $52,910, confirming the bearish trend.
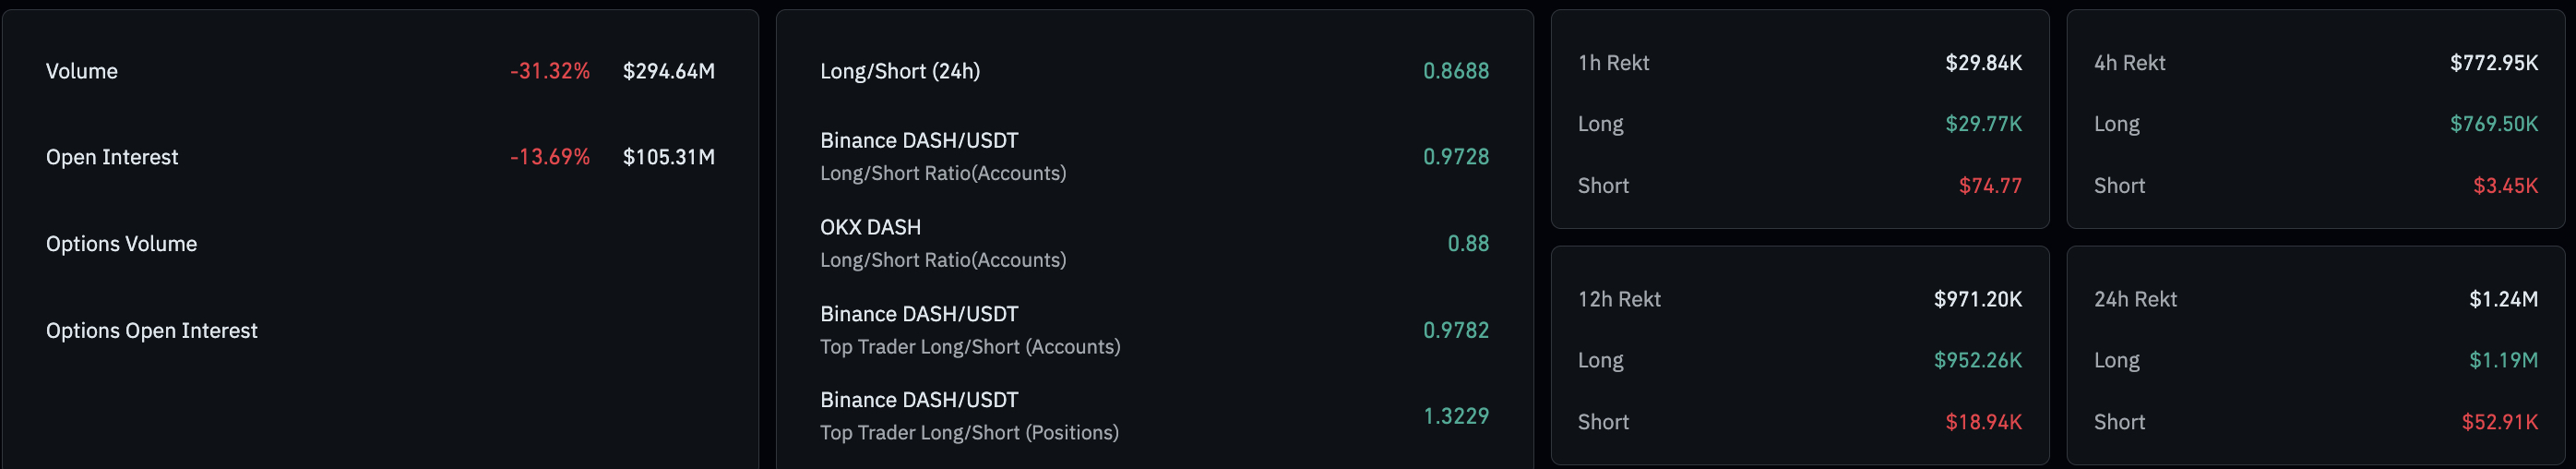
Dash derivatives data. Source: Coin Glass
Dash is facing a sharper correction to $50
The $DASH has dropped by about 40% over the past two weeks, approaching the 50-day Exponential Moving Average at $55.93, as bulls attempt to limit further losses. However, the 50-day Exponential Moving Average remains above the 200-day Exponential Moving Average.
If Dash closes today below $55.93, it is likely to extend the decline to the psychological support level at $50, near the 23.6% Fibonacci retracement level at $49.39, measured from the high of November 4 at $150.00 to the low of December 19 at $35.04.
Technical indicators on the daily chart indicate an increase in bearish momentum. The Moving Average Convergence Divergence (MACD) shows that the blue and red lines are trending towards zero while the negative histogram widens. The Relative Strength Index (RSI) is at 46, sliding from the neutral zone with a downward tilt, suggesting an early stage of increased selling pressure.
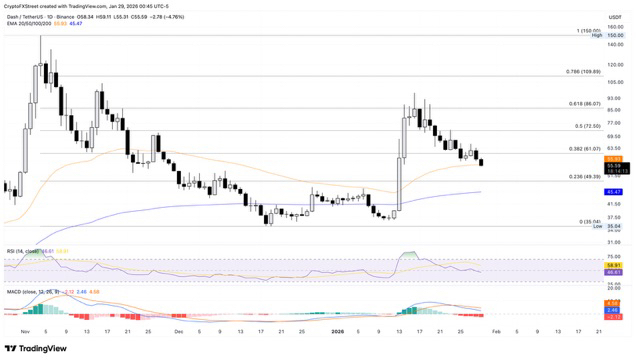
The daily chart of Dash/Tether price.
However, a potential daily close above the 50-day Exponential Moving Average at $55.93 would alleviate immediate pressure and direct the privacy coin towards the 38.2% Fibonacci retracement level at $61.07.
#DASH #BinanceSquareFamily #BinanceSquare #BinanceSquareTalks #BinanceHerYerde