📊 ChessCoin (CHESS) — Brief Market Analysis
What it is:
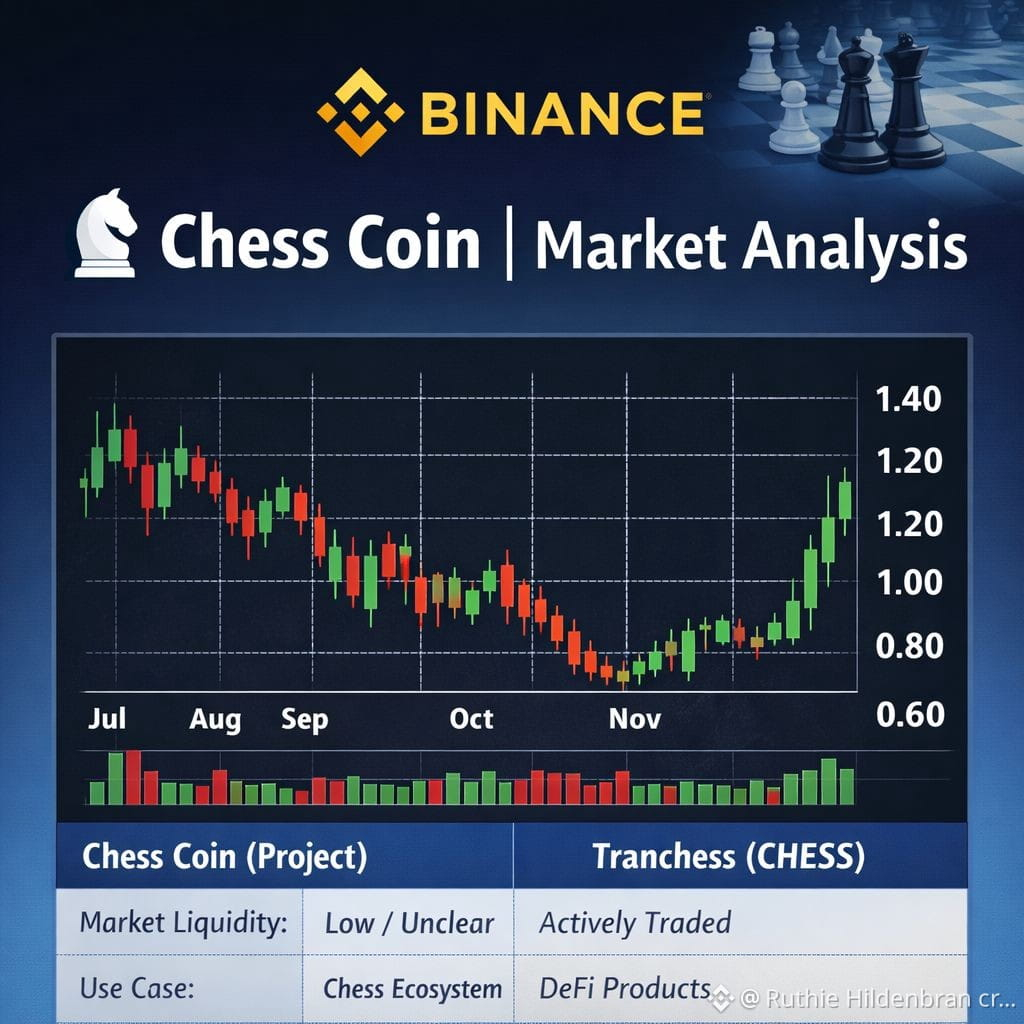
ChessCoin (ticker: CHESS) is a niche cryptocurrency token that has been listed on some public price trackers like CoinGecko and CoinMarketCap. It’s relatively low–market cap and lightly traded compared with major assets, meaning liquidity and volatility can be high. �
CoinGecko +1
Recent price levels:
According to CoinGecko, one CHESS has been trading near ~$0.096 (≈ ₨29 PKR) recently. �
CoinGecko +1
Historical highs for some versions of the token reached above $2 in past years, but current prices are far below those peaks. �
CoinGecko
Volatility:
Small cap tokens like this tend to have large swings — good if you’re trading, risky if you’re holding long term.
Trend snapshot:
Over a short window, CHESS looks to have seen modest daily fluctuation but not large directional moves. This suggests relatively sideways movement in the very short term. �
CoinGecko
Caution:
Smaller crypto assets often come with higher risk due to thin liquidity, low institutional interest, and sometimes unclear fundamentals. Always DYOR (do your own research).
📈 Candlestick Summary Table (Recent Days)
The table below shows daily OHLC (Open, High, Low, Close) price data for CHESS (in USD) from 28 Jan 2026 to 03 Feb 2026 — useful for interpreting short-term trend and candle patterns:
Date
Open
High
Low
Close
28 Jan 26
0.0813
0.0824
0.0808
0.0813
29 Jan 26
0.0813
0.0813
0.0760
0.0771
30 Jan 26
0.0771
0.0771
0.0740
0.0767
31 Jan 26
0.0767
0.0767
0.0691
0.0716
01 Feb 26
0.0717
0.0722
0.0689
0.0702
02 Feb 26
0.0701
0.0722
0.0679
0.0717
03 Feb 26
0.0717
0.0720
0.0690
0.0690
(Prices approximate; sourced from Investing.com historical data.) �
Investing.com
🕯️ Text-Based “Candle Chart” Visualization
Here’s a simplified ASCII candlestick representation showing price action (Up days in green, Down in red). Each candle’s body spans Open to Close; wicks reach Low/High roughly to scale.
Date Low Open/Close High
28Jan ▬■■■■■■■■■■■■■■■■■■■■■▬
29Jan ▬■■■■■■■■■■■■━━■■■■■■▬
30Jan ▬■■■■■■■■■■■■■■■■■■■▬
31Jan ▬■■■■■■■■━━■■■■■■■■▬
01Feb ▬■■■■■■■■■■━━■■■■■■▬
02Feb ▬■■■■■■■■■■■■■■■■■■▬
03Feb ▬■■■■■■■■━━■■■■■■■▬
Legend:
■■■ = Body of candle (Open–Close)
▬ = Wick (range outside body)
Color (green/red) isn’t shown in ASCII, but you can interpret: if Close > Open, it’s a green candle; if Close < Open, it’s red.
Based on the table above:
Bullish days (Close > Open): 02 Feb
Bearish days (Close < Open): 29 Jan, 31 Jan, 01 Feb, 03 Feb
Neutral / small change: 28 Jan, 30 Jan
🧠 What This Suggests
Sideways trading: The price isn’t trending strongly up or down over this week.
Short-term volatility: Day-to-day moves are noticeable but not huge.
Range-bound: Prices have largely stayed between $0.068 and $0.082 recently.
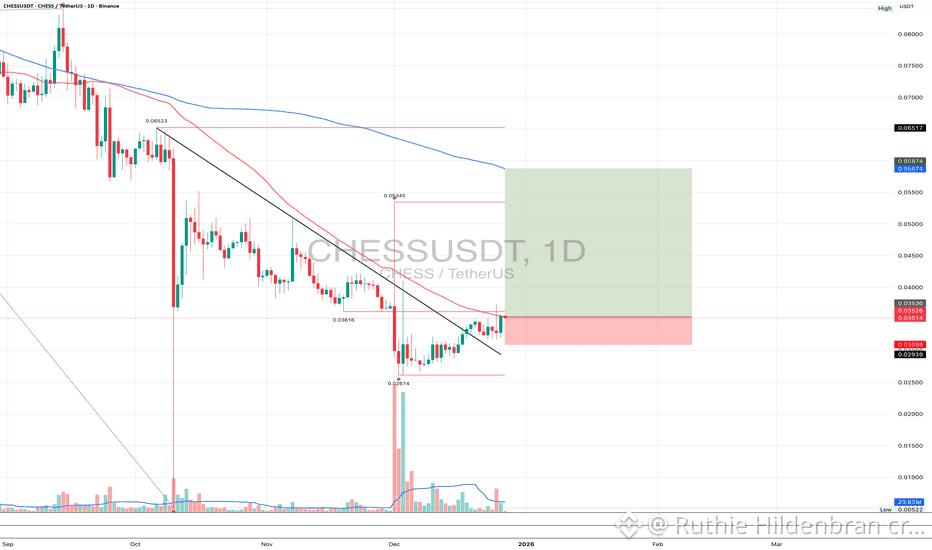
📈 Candlestick Chart (Example for CHESS Token)
Below is a daily candlestick chart snapshot for Tranchess CHESS (the traded token with real market data) to illustrate typical price action and how candlesticks help analyze trends. 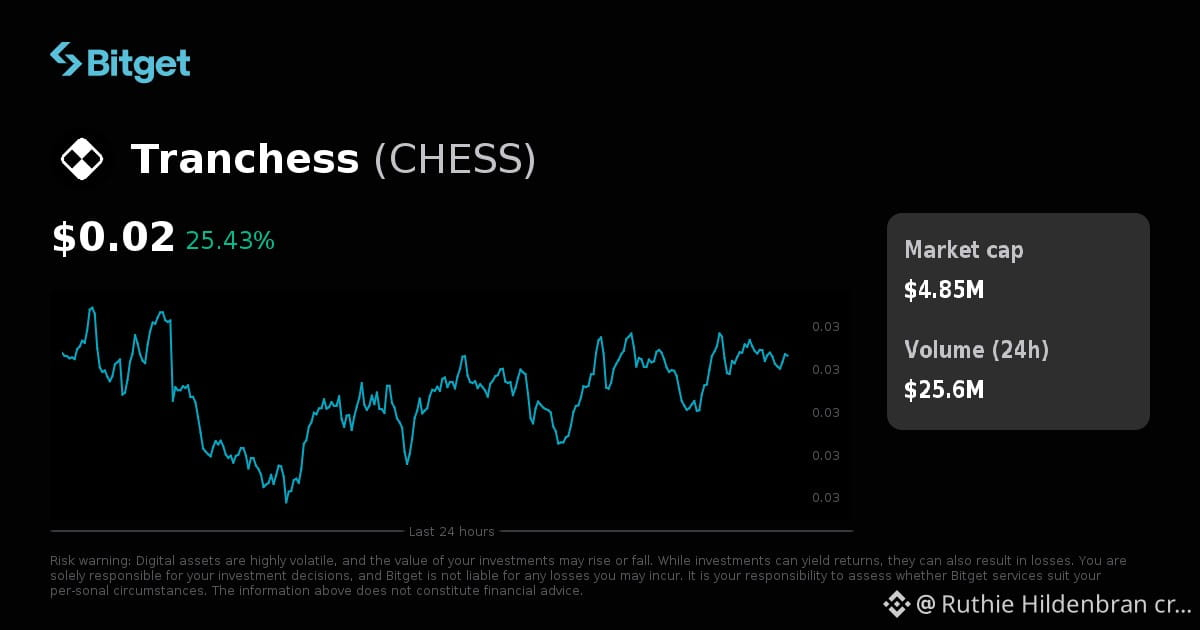
#TrumpProCrypto #GoldSilverRebound #StrategyBTCPurchase