At the time of writing, $BTC is trading near $78,000, and based on current market structure, liquidity positioning, and technical confluence, the probability favors a short-term corrective move toward the $71k–$72k region before any sustainable upside continuation.
This is not a random level. It is a structurally important zone.
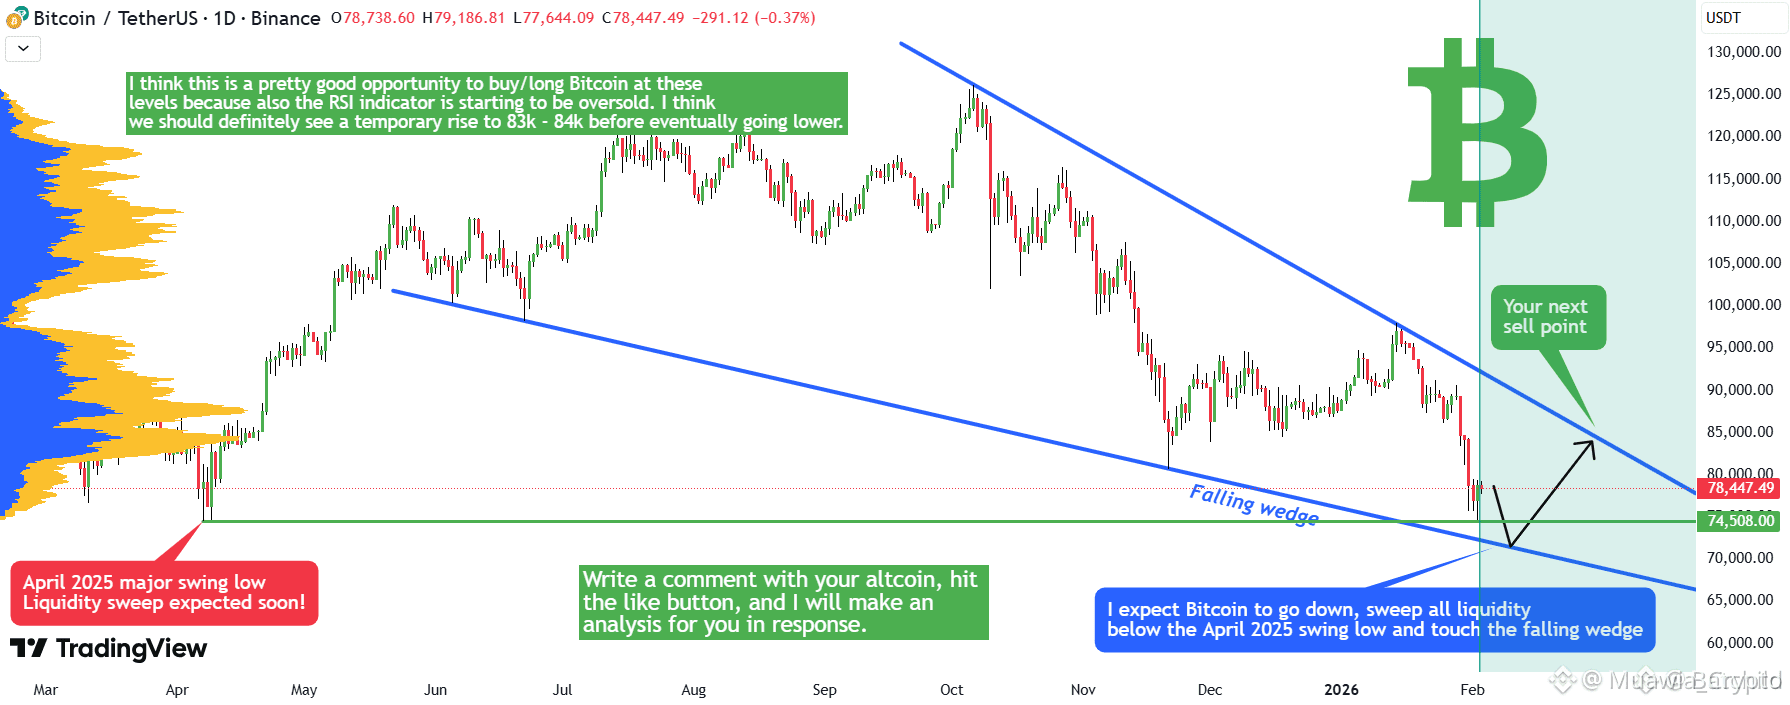
🧠 1. Unresolved Liquidity Below the April 2025 Swing Low
Markets are driven by liquidity engineering, not emotions.
One of the most notable inefficiencies on the chart is that price has not yet swept liquidity resting below the April 2025 swing low. This area is highly significant because:
Retail traders commonly place stop losses below obvious swing lows
Algorithmic systems target clustered liquidity
Institutions accumulate positions where forced selling occurs
Historically, meaningful upside expansions in BTC often begin after downside liquidity has been cleared, not before. Until that pool is taken, upside breakouts remain structurally weaker.
In other words:
➡️ The market still has unfinished business below.
📐 2. Falling Wedge Structure & Technical Confluence
Price action is compressing within a downward-sloping falling wedge, a pattern typically associated with eventual bullish resolution — but only after final structural retests.
The projected support retest zone:
$71k–$72k
Why this region matters technically:
Aligns with the lower wedge boundary
Overlaps with prior demand reaction
Sits near high-liquidity stop clusters
Psychological round-number support
This creates a high-probability reaction zone, not just a random price guess.
📊 3. Momentum Behavior (RSI Context)
RSI is gradually approaching oversold territory on lower timeframes, signaling:
Seller momentum is expanding but nearing exhaustion
Risk/reward begins improving for longs if structure holds
Potential for a relief rally once liquidity is taken
Oversold RSI alone doesn’t reverse markets — but when combined with liquidity sweep + structural support, probabilities shift.
🔄 4. Expected Sequence (Probable Flow Model)
Based on current structure, the more logical market path is:
Step 1: Liquidity sweep into $71k–$72k
Step 2: Strong relief rebound toward $83k–$84k
Step 3: Decision point — breakout or rejection from wedge resistance
That rebound will be critical. If bulls cannot reclaim and hold higher structure, it increases the probability that the broader market is transitioning into a larger distribution phase rather than continuation.
⚠️ 5. Bigger Picture Risk
While the $72k region may offer a tactical long opportunity, it does not automatically imply cycle continuation.
Later in the year, if macro liquidity tightens and risk markets weaken, Bitcoin could still revisit sub-$60k levels in a deeper corrective phase. Markets move in layers, not straight lines.
🪙 Altcoins Outlook
I’m not favoring aggressive altcoin exposure right now.
Why:
Altcoins typically underperform during BTC structural uncertainty
Liquidity concentrates into majors first
Mid-term trend for alts still shows distribution characteristics
A more favorable accumulation window for alts may appear much later, when:
BTC volatility compresses
BTC dominance stabilizes
Risk appetite returns
Right now = selective, not aggressive.
🔍 Summary Plan
Short term:
➡️ Watch for a move into $71k–$72k
After sweep:
➡️ Potential rebound toward $83k–$84k
Bigger picture:
➡️ Structure later in the year could still allow deeper downside
This is a liquidity-driven map, not prediction hype. Price confirms, not opinions.
Disciplined trading isn’t about catching every move — it’s about understanding where the market is most likely to react and managing risk accordingly.
Stay patient. The best trades come from levels, not emotions. 📊#BTC