Bear Flag Continuation in Progress — Risk Regime Turning Defensive
Market: BTCUSDT
Current Condition: Corrective recovery within bearish structure
Primary Bias: Downside continuation unless invalidated
Environment: Risk-off macro overlay + weakening technical momentum
Executive Summary
Bitcoin is transitioning from a post-impulse stabilization phase into a structurally vulnerable compression pattern, with price action now reflecting bearish continuation dynamics rather than accumulation. Both macro liquidity conditions and technical positioning suggest the market is not yet ready for sustained upside expansion.
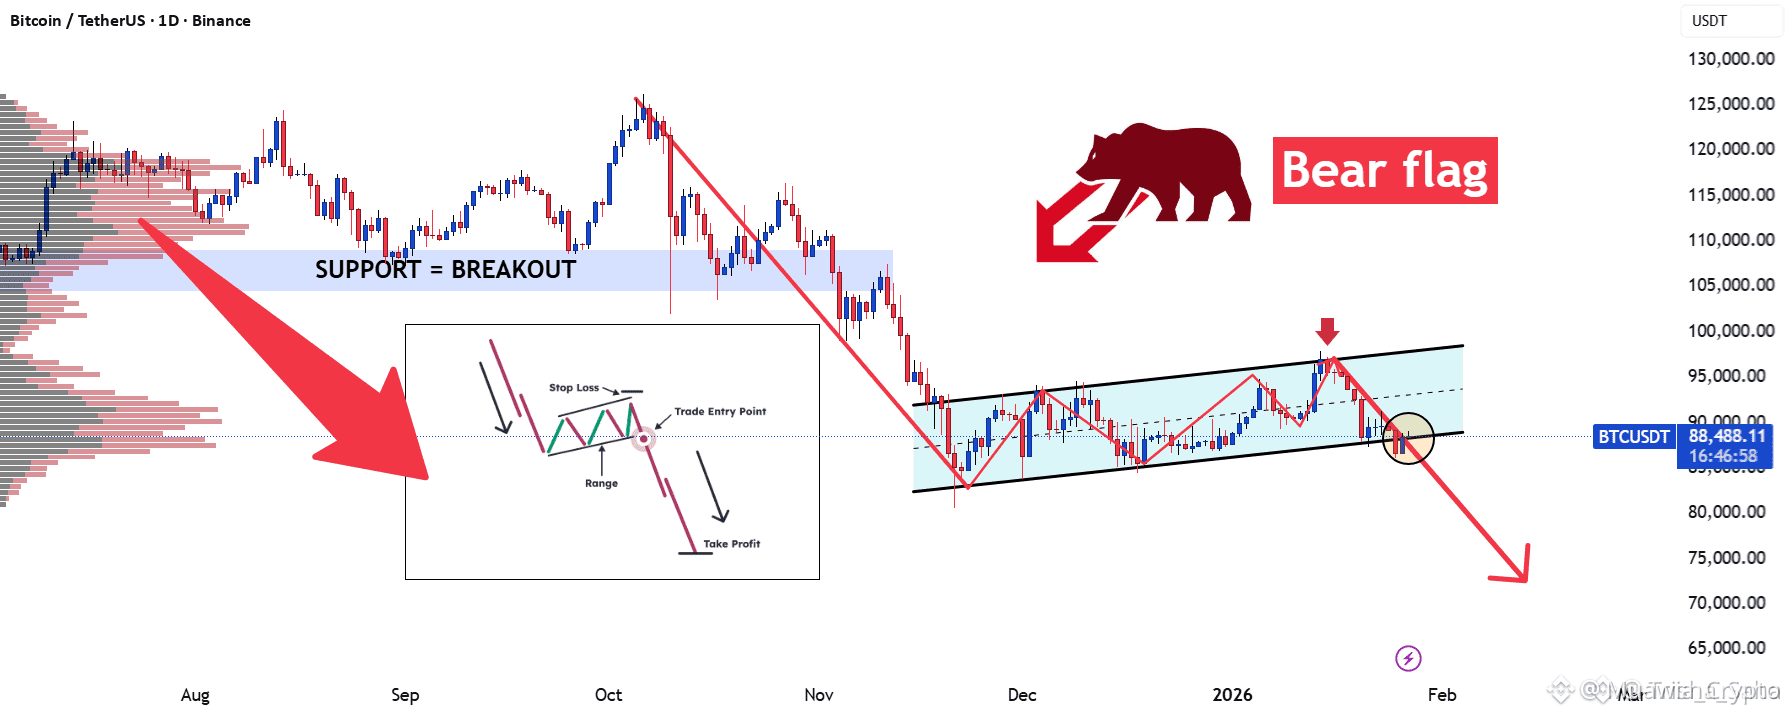
The current structure resembles a textbook Bear Flag formation following an aggressive sell-side impulse — historically a high-probability continuation setup when confirmed by weakening participation and macro headwinds.
Unless BTC reclaims key structural resistance with conviction, the probability distribution favors further downside exploration into deeper liquidity zones.
1. Macro Liquidity Backdrop — Headwind for Crypto
Bitcoin is not trading in isolation. Its current structure is forming under a tightening global liquidity regime.
Key Pressures
1️⃣ Stronger U.S. Dollar (DXY Firmness)
A strengthening dollar mechanically reduces global liquidity availability. Risk assets — particularly speculative ones like crypto — typically underperform during dollar strength cycles.
2️⃣ Elevated U.S. Treasury Yields
Higher yields:
Increase opportunity cost of holding non-yielding assets (BTC, gold)
Pull institutional capital toward fixed-income instruments
Reduce speculative risk allocation
3️⃣ Fed Policy Expectations
Markets are adjusting to the reality that:
The Federal Reserve is not in a hurry to ease
“Higher for longer” suppresses liquidity expansion
Risk assets struggle without fresh monetary impulse
4️⃣ Institutional Positioning Behavior
Large funds are:
Slowing capital deployment
Increasing cash buffers
Reducing directional conviction in high-beta assets
This environment historically aligns with distribution and corrective structures, not the start of new impulsive bull legs.
2. Technical Structure — Bear Flag Development
Phase 1: Impulsive Sell-Off
BTC printed a strong downside displacement move — wide spreads, momentum expansion, and liquidity void creation. This defines the flagpole.
Phase 2: Weak Corrective Recovery
The rebound that followed shows characteristics of a corrective move, not a reversal:
Overlapping candles
Declining volume on push-ups
Failure to reclaim major supply zones
Momentum divergence on lower timeframes
This recovery is compressing inside an upward-sloping channel — a classic Bear Flag.
3. Why This Pattern Matters
Bear Flags represent:
Controlled relief rallies inside dominant sell pressure
They occur when:
Short-term buyers attempt recovery
But higher-timeframe sellers use strength to distribute
As long as price remains capped beneath the flag resistance trendline, the structure signals:
Sellers are not finished. They are repositioning.
4. Market Psychology Shift
We’re seeing a transition from:
Previous Phase
Current Phase
Dip buying enthusiasm
Rally selling behavior
Momentum expansion
Volatility compression
Retail optimism
Institutional caution
Breakout expectation
Breakdown risk
This psychological rotation is typical before continuation legs, not before major reversals.
5. Liquidity Map & Downside Path
Below the current structure lie:
Untested demand imbalances
Resting stop clusters from late buyers
Inefficient price delivery zones
Markets naturally seek these pools. If the flag breaks down, BTC is likely to accelerate toward these lower liquidity pockets, as continuation patterns often resolve with volatility expansion.
6. Invalidation Conditions
The bearish scenario weakens if BTC:
Breaks above the flag structure with strong volume
Reclaims prior supply as support
Shows momentum expansion rather than compression
Until that occurs, upside moves are structurally corrective, not impulsive.
7. Strategic Outlook
This is not a collapse call. It’s a structure recognition phase.
The market currently shows:
✔ Weak bullish follow-through
✔ Macro liquidity resistance
✔ Corrective upward channel
✔ Classic continuation geometry
All point toward probability favoring further downside before any sustainable bullish phase can develop.
Final View
BTCUSDT is not in accumulation — it is in a controlled corrective pause within a bearish continuation structure.
Unless structural resistance is decisively reclaimed, rallies remain vulnerable, and the path of least resistance stays tilted to the downside.$BTC
