
ATOM remains locked in a multi-year downtrend, respecting a well-defined descending resistance and support channel.
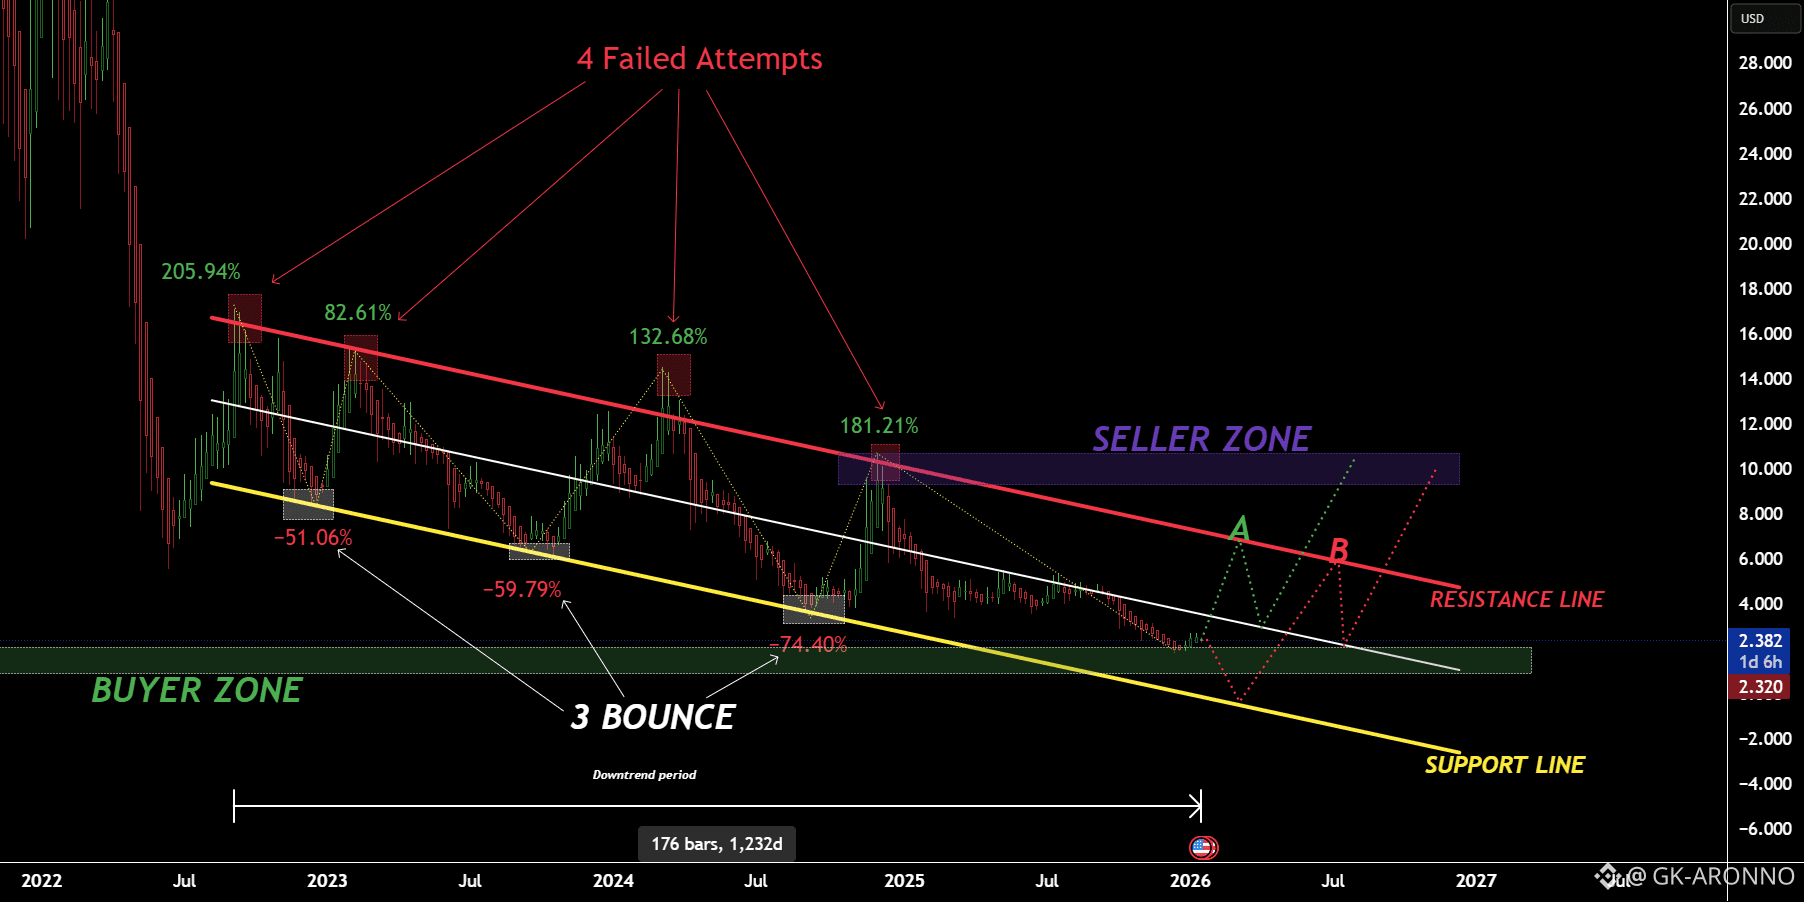
🔴 4 Failed Breakout Attempts
Price has rejected the red resistance line four times, with rallies ranging from +82% to +205%, each followed by deeper sell-offs. This confirms strong seller control at higher levels.
🟢 Buyer Zone Holding (So Far)
The green buyer zone has produced 3 significant bounces during the downtrend:
-51%
-59%
-74%
Each bounce has weakened, signaling declining demand strength.
📉 Trend Structure
Lower highs + lower lows = trend still bearish
White MA acting as dynamic resistance
Yellow support trendline is the last major structural support
⚠️ Key Levels to Watch
Buyer Zone: Critical for short-term reaction
Seller Zone (Purple): Major supply area + trendline confluence
Resistance Line (Red): Must be broken on a weekly close to shift bias
📌 Scenarios
A (Bullish Relief): Bounce from buyer zone → retest seller zone → potential rejection
B (Bearish Continuation): Loss of buyer zone → breakdown below support → new lows before any sustainable reversal
💡 Bias:
Until ATOM reclaims the descending resistance on a weekly close, rallies remain sell-the-bounce setups. Patience is key — structure > hope.
✅ Trade here on $ATOM
