Everyone's looking at the green candle (+1.68%). I'm looking at the order book that's screaming sell.

Here's the data your chart won't show you:
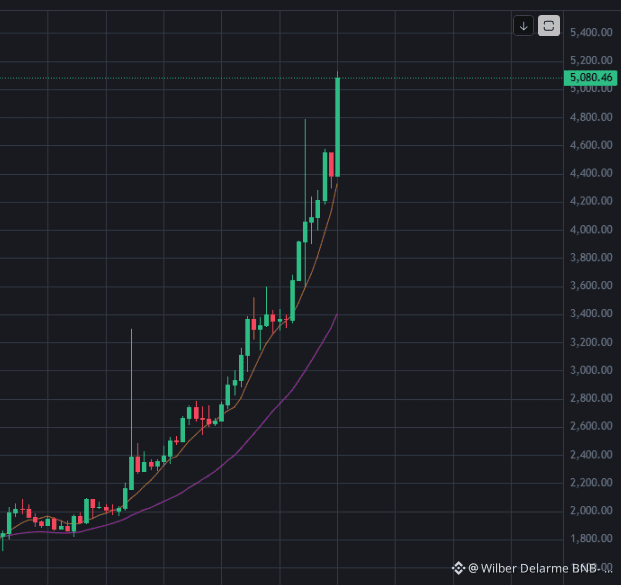
Price: $5,086.04
24h Change: +1.68%
Buy/Sell Pressure: 21% Buy / 79% Sell
The Story: A wall of sell orders is stacked just above the current price. This isn't accumulation; it's distribution.
What This Really Means:
PAXG (gold-on-chain) is the ultimate "fear gauge." When it rallies, it signals risk-off. But this chart isn't showing fear—it's showing profit-taking.
The narrative is breaking down. The "safe haven" trade is being sold into strength. This is capital preparing to rotate.
The Alpha:
This is a Liquidity Check: The 24h high (~$5,125) is the line in the sand. If PAXG can't break and hold above it with real buy volume, this rally is a trap. The order book suggests it's a trap.
Watch for the Rotation: If this selling pressure holds, watch where the money flows next. Does it go back into BTC/ETH (bullish for general market)? Or into stablecoins (bearish, signaling deeper risk-off)?
The Contrarian Play: The crowded trade is long PAXG after a 10% weekly pump. The order book shows the smart money is taking the other side.
Bottom Line: In crypto, the "why" is more important than the "what." The "what" is a green candle. The "why" is hidden in the sell-side pressure. Don't just look at the price. Read the liquidity.
