Bitcoin has entered a high-volatility regime in early 2026, characterized by significant institutional deleveraging and subsequent "dip-buying" behavior.
Below is a breakdown of the current market state:
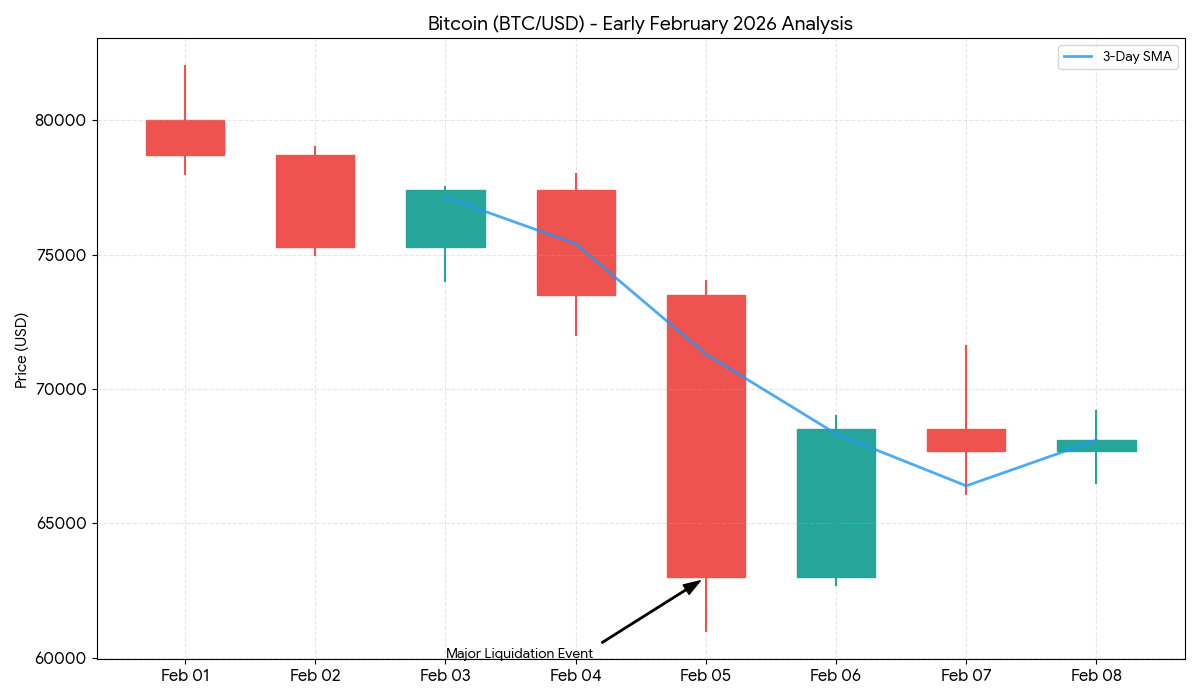
1. Technical Outlook:
The "February Flush"The chart highlights a dramatic liquidation event on February 5th, where Bitcoin plummeted from approximately $\$73,500$ to a local low of $\$61,000$. This $17\%$ intraday drop was likely driven by a "long squeeze" in the derivatives market.
Support & Resistance:
Immediate support has formed at the $$61,000 – $\$63,000$ zone. The market is currently testing resistance near $\$70,000$.
Trend Indicator:
The 3-day Simple Moving Average (SMA) is beginning to flatten out, suggesting that the aggressive downward momentum from earlier in the week is losing steam, and the price is entering a consolidation phase.
2. Fundamental Drivers Macro Environment:
The primary catalyst for recent volatility has been the market's adjustment to the new Fed Chair nomination and shifting expectations regarding inflation targets for 2026.
Institutional Flows:
Despite the price drop, on-chain data shows significant "whale" accumulation during the sub-$\$65k$ wick, indicating that long-term institutional conviction remains high despite short-term macro turbulence.
Cycle Context:
Being nearly two years post-2024 halving, BTC is in a mature phase of its cycle. While the era of $100\%$ monthly gains may be behind us for this cycle, the asset is demonstrating increased stability at higher price floors.3.
Summary & Sentiment
The sentiment has shifted from "Extreme Greed" in January to "Fear" following the Feb 5th crash. Historically, such flushes are necessary to clear excess leverage before a sustainable move toward previous all-time highs ($100k+ territory). Traders are currently watching for a daily close above **$$71,600** to confirm a trend reversal.
#USIranStandoff #WhenWillBTCRebound #ADPDataDisappoints #WhaleDeRiskETH #BTC走势分析