

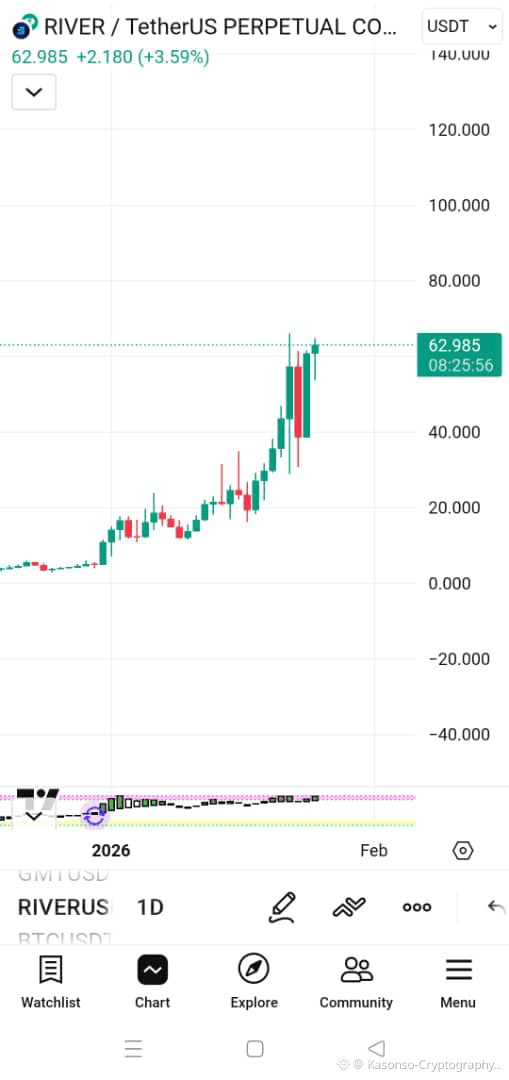
First thing that jumps out immediately: price is strong, no doubt. $RIVER is trading around 62.9, up more than +3.5%, and the structure before this level already tells a story.
What the candles are saying
Look at the recent candles carefully. You can see a series of strong green candles pushing price higher step by step. That’s not random. That means buyers are clearly in control and they are not scared to buy higher prices.
Then we get that big bullish candle that breaks above previous levels. That one is important. It shows momentum, like when a crowd suddenly starts running in one direction and others just follow.
After that, we see a small pullback candle (red), but notice something very important:
👉 the pullback is not aggressive.
👉 sellers tried, but they failed to push price down deeply.
This is usually healthy. Strong markets don’t go up in a straight line, they breathe.
The active candle and direction
Now, the current active candle is sitting above the previous consolidation zone. That’s bullish behavior. The price is holding higher, not rushing back down.
If we describe the likely candlestick behavior from here:
First, a small-bodied green candle or a candle with short wicks may form, showing consolidation.
Then, if buyers remain confident, the next candle is likely to be another bullish continuation candle, possibly breaking the recent high.
Worst-case healthy scenario: a small red candle with long lower wick (buyers defending support).
What we don’t want to see (and currently don’t see):
❌ big red engulfing candle
❌ strong rejection wick from the top
❌ sudden volume spike to the downside
So far, none of those danger signs are present.
Direction of price (realistic view)
Based on this chart alone, the direction is still UP, but in a controlled way. Think of someone walking uphill, not sprinting, not falling. That’s strength.
A simple example for beginners:
Buying at 20 and seeing price at 60 doesn’t mean it must crash.
Strong assets often pause at the top, then continue.
Weak assets spike once and collapse. This one didn’t collapse.
Positive conclusion
RIVER is showing:
>Higher highs
>Higher lows
>Strong bullish candles
>Shallow pullbacks
That combination usually favors continuation, not reversal.
So as a trader reading this chart calmly:
👉 buyers are still active
👉 momentum is still alive
👉 price direction remains bullish unless structure breaks
Patience is key now. Let the candles talk, and right now, they’re still speaking bullish language.
